|
Project Supported by
|
NSF, National Science Foundation
KICP, Kavli Institute for Cosmological Physics
USAP, United States Antarctic Program
Antarctic Support Contract
|
|
|
Related Websites
|
CBI, Cosmic Background Imager
DASI, Degree Angular Scale Interferometer
WMAP, Wilkinson Microwave Anisotropy Probe
|
|
|
|
 | Overview |
|
|
|
| |
This page provides data products associated with the combined SPT-SZ + SPTpol power spectrum measurement over 2500 square degrees described in arXiv:2002.06197, Reichardt et al., 2020. The power spectra at 95, 150 and 220 GHz are presented over the angular multipole range 2000 < ell < 11000, and can be used to study models using the likelihood package provided below.
If you have any questions regarding this data set or its use, please contact Christian Reichardt (christian_dot_reichardt_at_unimelb_dot_edu_dot_au).
|
| |
| Figures |
|
 |
|
| |
Individual figures are available in PDF format here or bundled in a tarball here. We highlight some figures below.
| 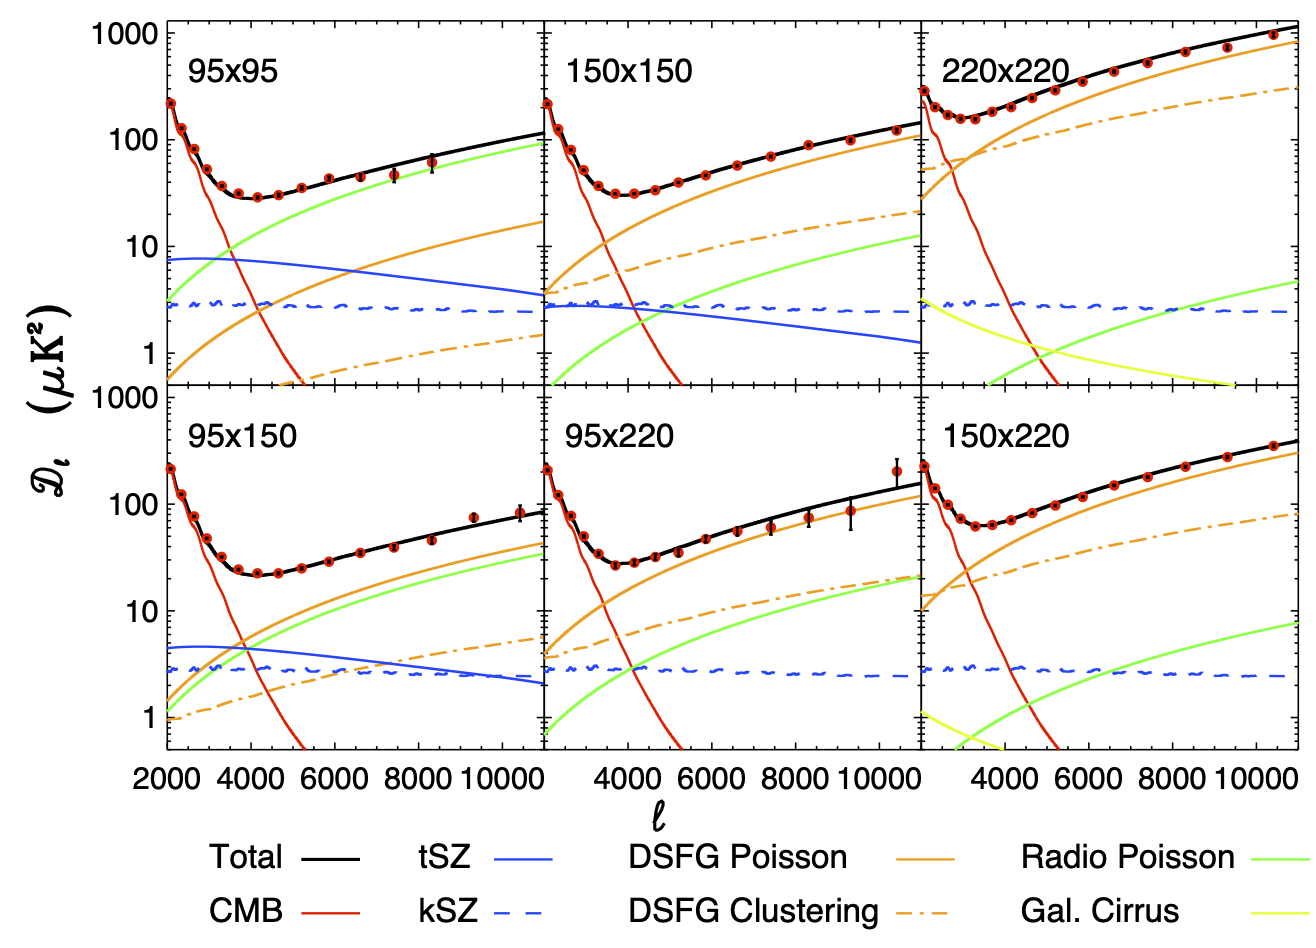 The six auto- and cross-spectra measured with the 95, 150, and 220 GHz SPT data. Overplotted on the bandpowers is the best-fit model for the fiducial set of model parameters. (Figure 2 in Reichardt et al., 2020)
|
 2D posterior likelihood surface for the tSZ and kSZ power at 143 GHz and ell=3000 in the baseline model including tSZ-CIB correlations. 1, 2, and 3 sigma constraints are shown in shades of blue. The observed degeneracy is due to the correlations between the tSX and CIB.
(Figure 3 in Reichardt et al., 2020)
2D posterior likelihood surface for the tSZ and kSZ power at 143 GHz and ell=3000 in the baseline model including tSZ-CIB correlations. 1, 2, and 3 sigma constraints are shown in shades of blue. The observed degeneracy is due to the correlations between the tSX and CIB.
(Figure 3 in Reichardt et al., 2020)
|
 1D posterior likelihood curves for DeltaZ of reionization with three assumptions about the homogeneous kSZ power. The solid blue line is for the expected amount of kSZ power, while the dotted and dashed lines reflect the cases where the homogeneous kSZ power is scaled by x0.75 or 1.25 respectively. With the best estimate of the homogeneous kSZ power, the 95% CL upper limit on the duration of reionization is DeltaZ < 5.4. Adding the tSZ bispectrum prior from Crawford et al. (2014) strengthens this limit to DeltaZ < 4.1, as shown by the solid black line. (Figure 5 in Reichardt et al. 2020)
|
| |
| Bandpowers for plotting |
|
|
|
| |
We provide a text file with the lcenters (at 150x150 GHz), bandpowers for each of the six cross-spectra and 1 sigma uncertainties (from the diagonal of the covariance matrix). This is intended for plotting purposes only; to derive model constraints please use the full covariance matrix provided in the likelihood code below.
|
| |
| Likelihood Code |
|
|
|
| |
We provide files in a gzipped tarball here that can be added to the Jul19 version of CosmoMC to interface with the SPT multi-frequency bandpowers discussed above. These files include the SPT likelihood, foreground code, SPT data (bandpowers, covariance matrix, bandpower window functions, and beam error eigenvectors), batch file, and a README with instructions for how to compile CosmoMC with the SPT likelihood.
If you have any questions regarding the use of this likelihood, please contact Christian Reichardt (christian_dot_reichardt_at_unimelb_dot_edu_dot_au).
v1.0: Feb 16, 2020 - Initial version released with arXiv submission.
|
| |
|
|


