|
Related Websites
|
SZA, Sunyaev-Zel'dovich Array
|
|
|
|
 | Observing Strategy |
|
 |
|
| |
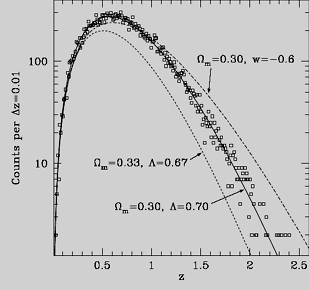
The high sensitivity and high angular resolution of the SPT will enable several ambitious scientific programs. The initial observational program will be a large survey for galaxy clusters detected by the Sunyaev-Zel'dovich Effect (SZE). The SZE is produced when CMB photons scatter off the hot electron gas in galaxy clusters; the brightness of the SZE is nearly independent of distance to the cluster, making it an ideal tool for conducting a mass-limited cluster survey. The abundance of massive clusters as a function of redshift is highly sensitive to the efficiency with which structure can grow, which is in turn sensitive to the expansion history of the universe. Therefore as shown in Figure 1, the redshift evolution of the abundance of massive clusters is critically sensitive to cosmological parameters such as the amount of dark energy and its equation of state. The SPT SZE survey will enable strong constraints on the amount of and nature of dark energy in the universe.
|
| |
 Figure 1. An illustration of the effect of cosmology on the expected number of SZE detected galaxy clusters as a function of redshift. The data points are appropriate for a 4000 square degree SPT survey with idealized sensitivity. The data points and the line passing through them were generated assuming a canonical ΩM = 0.3, ΩΛ = 0.7, &sigma8 = 1 cosmology. The other two lines show the large effect in the expected cluster counts due to slight changes in the cosmology. The value of σ8 was adjusted to give the same normalization for the local cluster abundance in each model. The bottom curve is for a model with more matter and correspondingly less dark energy. The top curve at shows the effect of only a change in the equation of state of the dark energy in the canonical model. (Figure courtesy of G. Holder)
|
| |
Recent results from measurements of degree-scale anisotropies in the CMB have spectacularly confirmed predictions of the Hot Big Bang cosmological model, and made precise measurements of many cosmological parameters. New experiments are now focusing on characterizing the temperature fluctuations on finer angular scales, where secondary anisotropies are expected to dominate over fluctuations imprinted on the last scattering surface.
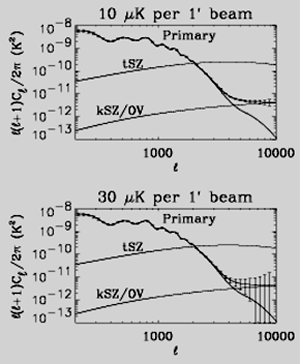
As shown in Figure 2, the largest source of anisotropy at multipole values l > 2000 is expected to be the thermal SZE. Measurements of the angular power spectrum of this signal - including or removing the massive clusters detected in the SZE survey - will allow tight determinations of the parameters σ8 and &OmegaM that are complementary to those obtained with analysis of the cluster survey.
|
| |
 Figure 2. An illustration of the potential of the SPT to measure fine-scale CMB anisotropy. The two panels show statistical errors on the high-l CMB power spectrum from 500 deg2 of sky measured at two different levels of noise per 1' beam. Both panels assume perfect subtraction of the thermal SZE signal and other astrophysical contaminants; achieving the required accuracy in this subtraction will be a significant challenge. (Spectra courtesy of W. Hu)
|
| |
The thermal SZE signal has a unique spectral signature. There is a null in the spectrum near 220 GHz, and the signal appears as a flux decrement (relative to the 2.7K background) at frequencies below this null and an increment at higher frequencies. This opens the potential for separating the SZE component from other contributions to the CMB power spectrum, such as the kinetic SZE (KSZ, due to the net motion of a cluster along the line of sight) and the Ostriker-Vishniac (OV) effect, which is a similar effect produced by structures that are still in the linear regime. Figure 2 shows how well an ideal 500 deg2 SPT survey could measure the fine-scale KSZ/OV anisotropy signal, assuming perfect compensation for the thermal SZE signal and other astrophysical contaminants.
|
| |
 | Atmospheric Noise |
|
 |
|
| |
Spatial fluctuations in atmospheric emission that are driven through the telescope beam by wind or scanning cause variations in the detector timestreams loosely referred to as "atmospheric noise". The extent to which atmospheric noise dominates instrument noise depends on the details of the site, telescope and detector array properties, frequency bands and observing strategy.
We have used a model of the fluctuations in atmospheric emission at the South Pole based on on the ACBAR observations to simulate two simple methods of removing atmospheric noise for a variety of telescope scan speeds. The first method is to apply a simple high-pass filter to the detector time-stream data, removing low-frequency atmospheric (and cosmic) signals. The second method exploits the extensive overlap of beams from various detectors in the array at the height of the turbulent layer in the atmosphere. In practice, we fit several spatial Fourier components across the array at each time step to remove the common-mode signal from each detector's time-stream data.
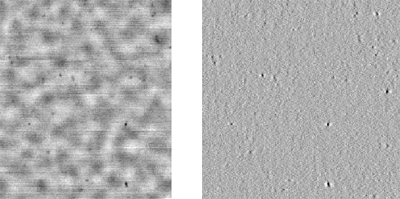
Figure 3 shows results from simple binning of a simulated SPT observation of primary CMB and SZE signals using a relatively slow scan rate of 2's-1 with the data processed according to the two methods described above to remove atmospheric fluctuations. We have tuned both methods to remove the same amount of atmospheric contamination. It is clear in the figure that the common-mode analysis retains cluster information on scales beyond typical cluster radii and also retains much of the CMB information. The high-pass filter, however, removed much of the larger-scale information. Galaxy clusters are easy to detect in both cases. With these algorithms and anticipated levels of detector and atmospheric noise, the cluster mass detection limit is only 10 - 20% higher at a scan rate of 2's-1 compared with an "infinite" scan speed. Thus we find that even relatively slow scanning of the entire telescope is a viable observing strategy, enabled by the extremely stable atmospheric conditions at the South Pole.
|
| |
 Figure 3. Two simple binned maps made from simulated array observations at 150 GHz and a scan speed of 2's-1 of a CMB-plus-SZE sky with atmospheric contamination and instrument noise with a 1/f knee at 0.1 Hz (SZE maps courtesy of M. White). The images are 3 degrees across. The two simulated observations were filtered using different methods to achieve the same level of atmospheric rejection.
Left Panel: results from a simulated observations in which the projection onto 16 low-frequency spatial modes across the array were subtracted at each time sample. The CMB structure is evident, as well as the cluster signals. The horizontal striping due to 1/f noise could be removed by a very weak high-pass filter with negligible effect on the CMB.
Right Panel: results from a simulated observation in which each individual bolometer time-stream data was high-passed at ~ 0.3 Hz. This removes nearly all of the CMB structure, but leaves the clusters quite visible.
|
| |
 | Frequency Band Considerations |
|
 |
|
| |
Our choice of bands, integration time, and survey area will be driven by particular science goals and the expected contaminants. We have two main goals in this regard:
- Minimize the effect of primary CMB and other astrophysical signals on SZE cluster detection and characterization,
- Construct a CMB map free of thermal SZE emission (and other astrophysical contaminants), enabling a measure of the CMB power spectrum (and higher order statistics) and KSZ/OV effects at high l.
|
| |
Each of these goals will require broad spectral coverage; atmospheric opacity limits our choices of bands to narrow windows centered near 95, 150, 220, 270, and 350 GHz. The expected sensitivity in each band (for single-moded, unpolarized detectors) is given in Table 2. We are currently working with simulations to determine the most favorable combination of bands and integration times (per band); the results of these simulations are in large part driven by the assumptions about the foreground emission.
|
| |

|
Table 2. Detector specifications and expected performance in each of the potential observations bands; the current baseline for the SPT is to observe in the 150, 219 and 274 GHz bands, subject to ongoing simulations of foreground removal. νo is the center of the frequency band and Δν is the bandwidth. T is average transmission of the atmosphere in the band. Po is the total optical power in the band for an observation at elevation 60o and an optical efficiency of 40%. G is the thermal conductivity of the detector. NETRJ and NETCMB are the noise equivalent temperatures in Rayleigh-Jeans and CMB temperature units. θfwhm is the full width at half-maximum of the diffraction limited telescope beam and NEFD is the noise equivalent flux density.
|
| |
At the angular scales of galaxy clusters and secondary CMB anisotropies, the dominant contaminants are expected to be extragalactic point sources of two flavors: flat spectrum radio sources, and luminous dusty galaxies. With the 1' angular resolution of the SPT, these are difficult to separate from most cluster SZE signals simply by spatial filtering, so we turn to estimating the spectral signatures of these sources.
Synchrotron emission from galaxies and AGNs is thought to be the main mechanism for radio point source emission at frequencies less than ~ 30 GHz. The steeply falling spectrum of synchrotron emission should make these sources a negligible contaminant at 150 GHz; however, there is evidence for a population of flat or inverted-spectrum sources. Furthermore, there is strong evidence that radio sources are preferentially associated with clusters, thus amplifying their contamination of SZE cluster surveys.
The level of the radio source contamination depends strongly on the number of such flat spectrum sources (as a function of flux) and their correlation with clusters. Neither of these is yet known with enough certainty to make accurate predictions. Favorable estimates for the source density and cluster correlation lead to the conclusion that both the SZE survey and the CMB measurement will be unaffected by these sources. However, even the most unfavorable estimates of the source density and cluster correlation indicate that only a small fraction of clusters will house a radio point source that could seriously impede SZE detection at 150 GHz. We have simulated observations assuming such worst-case radio point source scenarios, and find that the contamination affects the minimum mass of clusters detected by only 10 - 20%. Our understanding of the contamination from radio point sources will be aided with new interferometric data at 100 GHz from instruments such as the SZA.
Infrared point sources are a more likely contaminant of our survey. The SCUBA and MAMBO instruments have detected a family of sources at 240, 350, and 670 GHz, thought to be dust-shrouded starburst galaxies that emit longward of 100 µm (ν < 3000 GHz) as modified blackbodies. Large numbers of detections over a range of fluxes have resulted in reasonable statistics on the sources counts versus flux at 350 GHz. Recently, rest-frame spectral energy distributions and redshifts have been determined for 73 of these objects, providing a means to extrapolate the 350 GHz counts into our other candidate observing bands. The extrapolations indicate that SPT observations at 150 GHz will be contaminated by these sources. For this reason the SPT will have a high frequency "dust" channel that will be used as a monitor for these sources. The exact band or combination of bands that the SPT will use for this purpose is currently under study using a combination of Fisher-matrix-type sensitivity calculations and simulated observations.
While much work remains, the South Pole Telescope and bolometer array are currently on track for deployment to the NSF Amundsen-Scott South Pole station in late 2006. The SZE and CMB temperature anisotropy observations are scheduled to start at the beginning of the 2007 Austral winter.
|
| |
|
|