|
|
This website hosts data products associated with the sample of massive galaxy clusters selected via their Sunyaev-Zel'dovich effect signature
from the 2500d SPT-SZ survey, the SPTpol 100d survey, and SPTpol Extended Cluster Survey.
Here we report the locations (R.A, Dec. and redshift), selected mm-wave properties, and
estimated masses for these clusters. The masses are determined using a variety of
cluster observables and external datasets; more details
are provided below.
|
| |
 |
Selected Figures |
|
|
|
| |
|
|

Mass-Redshift Distribution of the SPT-SZ, the SPTpol 100d, and
the SPT-ECS cluster samples: Here we
compare the 2500 deg2 SPT-SZ cluster catalog, the
SPTpol 100d, and the SPT-ECS cluster sample to other
SZ-selected cluster samples. Plotted are the estimated mass versus redshift for
the 539 optically-confirmed clusters from the SPT-SZ catalog, 79
clusters from the SPTpol 100d sample, 448 SPT-ECS clusters, 220 clusters from the
ACT survey (Marriage et al. 2011; Hasselfield et al. 2013, Hilton et
al. 2017), and 1094 SZ-selected
clusters from the Planck survey (Planck Collaboration et al. 2013,
2015) with M500c > 1 x 10¹⁴ Msun h-1 .
As described in Bleem et al.
2015 and Bocquet et al. 2019, the SPT-masses are determined using the best-fit ξ-Mass scaling
relation for a flat LCDM cosmology with Ωm = 0.3, h=0.7 and
σ8 = 0.8. (This figure is updated from Figure 6 in Bleem et al. 2015.)
|
| |
|
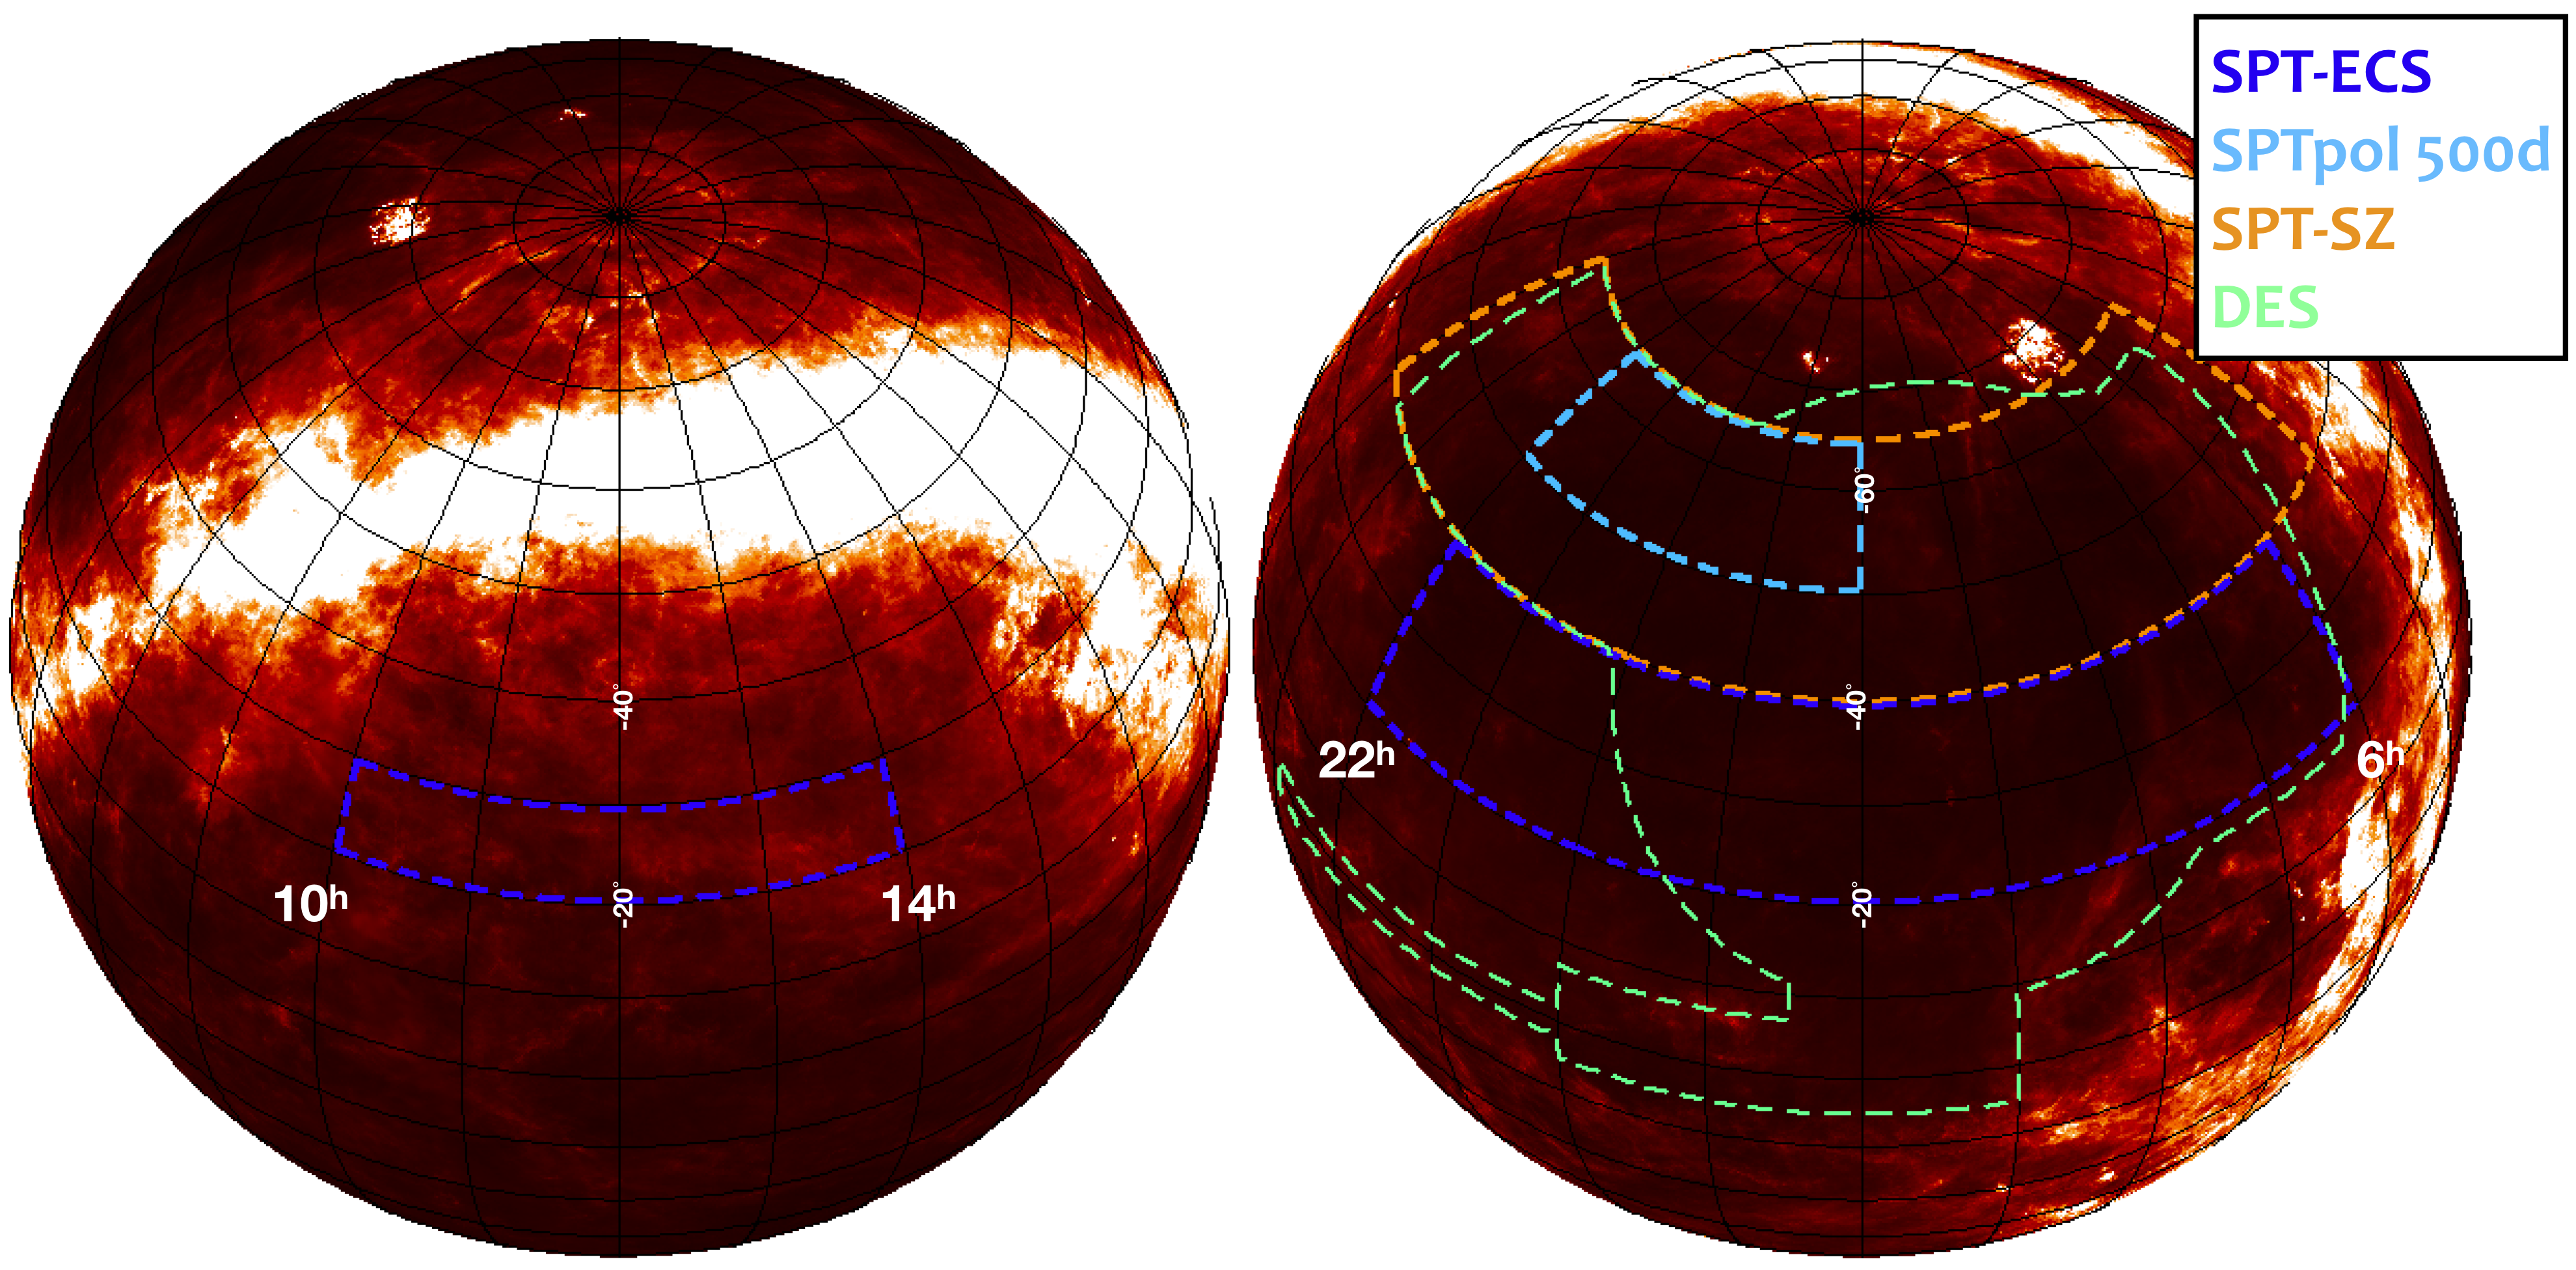
Footprints of the SPT-SZ and SPTpol surveys. The footprint
of the SPTpol Extended Cluster Survey is in dark blue,
SPT-SZ in orange, and the SPTpol 500d survey in light
blue.The footprint of the Dark Energy Survey is overplotted in green. (This is Figure 1 in Bleem et al. 2019.)
|
| |
|
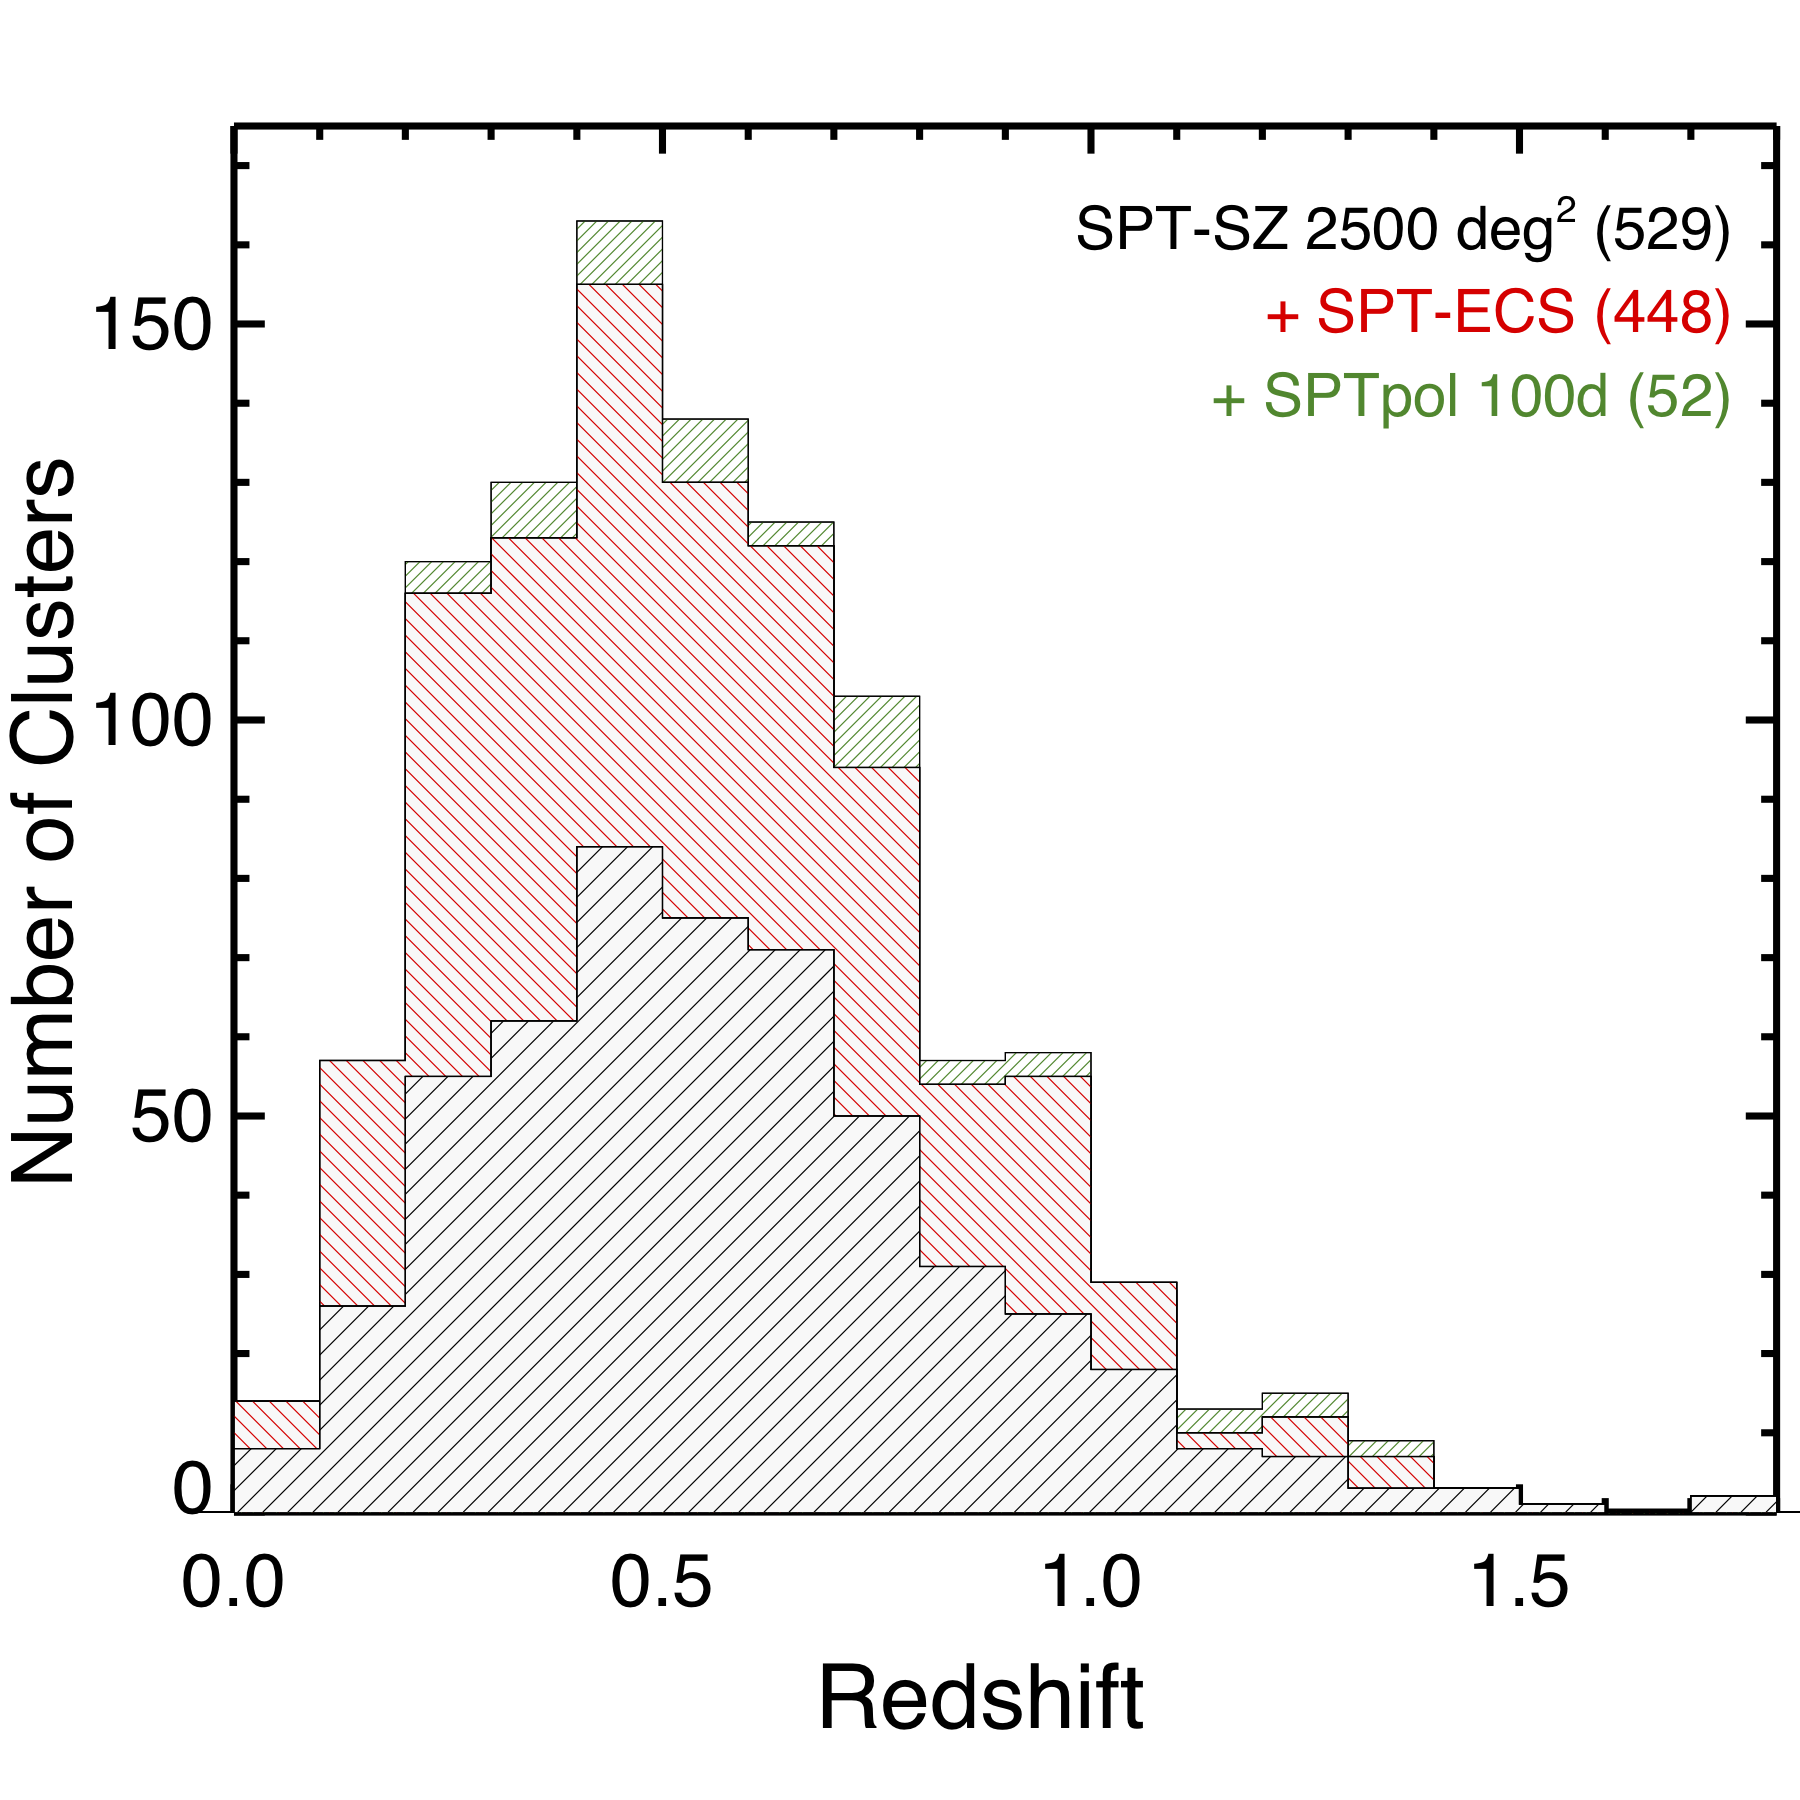
Redshift histogram of the three reported SPT cluster
surveys. The number of clusters in each survey---with each
cluster only reported once (so that e.g., clusters in both SPTpol
100d and SPT-SZ are only counted once)---are listed to the right of
each survey name. The contribution from the SPTpol 100d survey is
plotted on top in green right-diagonal hatch, the contribution from
the SPT-ECS survey is plotted in red left-diagonal hatch, and the
contribution to the total from the SPT-SZ survey is plotted in black
right-diagonal hatch. Combined with these other two samples, the
SPT-ECS sample brings the number of SZ-detected clusters reported by
the SPT collaboration to over 1,000. (This is part of Figure 5 in Bleem et al. 2019.)
|
| |
|
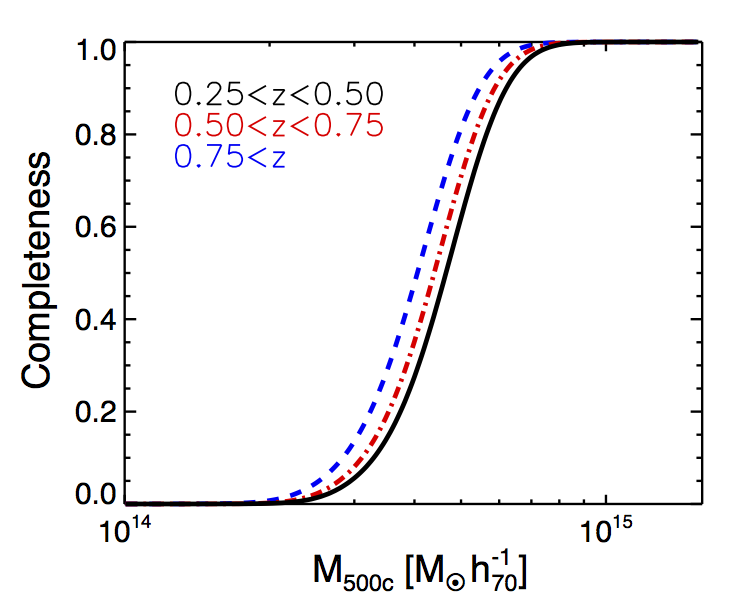
Completeness of the SPT-SZ Cluster Sample: Fractional completeness as a
function of mass for the SPT cluster sample in three different redshift bins:
0.25 < z < 0.5 (solid black), 0.5 < z < 0.75 (dot-dashed red), z
> 0.75 (dashed blue). This result is based upon the best-fit ξ-Mass
scaling relation for a flat LCDM cosmology with Ωm = 0.3, h=0.7
and σ8 =0.8. The SPT sample is expected to be nearly 100%
complete for M500c >7×10¹⁴ h-1
Msun at z > 0.25. Adopting the best-fit Planck
cosmology shifts the mass thresholds up ~17%. (This is Figure 7 in Bleem et al. 2015.)
|
| |
|
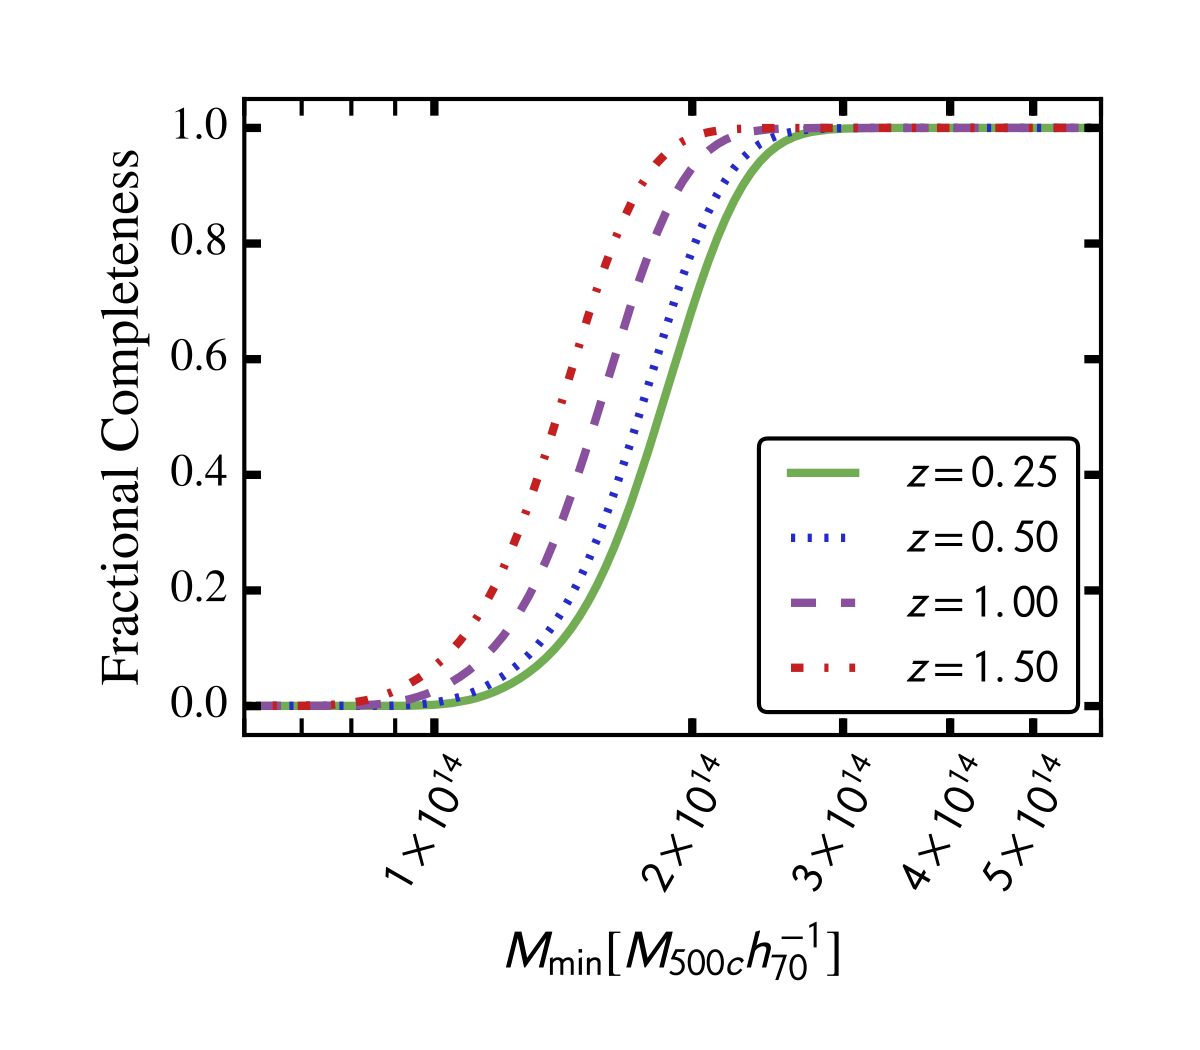
Completeness of the SPTpol 100d Cluster sample:
The estimated completeness as a function of M500c for the SPTpol 100d catalog. Completeness is estimated at four redshifts: 0.25, 0.50, 1.00, and 1.50. (This
is Figure 5 in Huang et al.
2019.)
|
| |
|
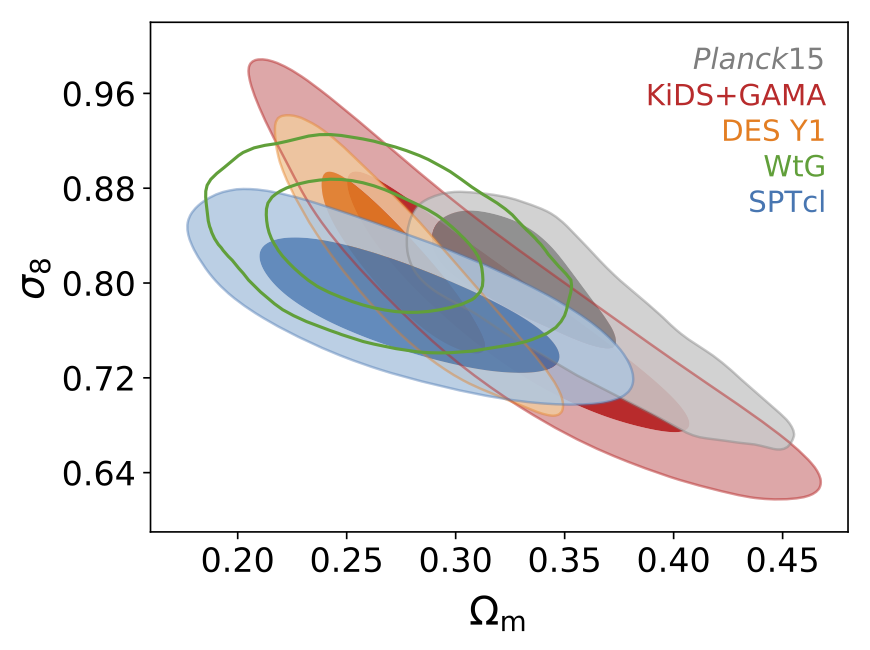
Weak-lensing calibrated cosmology constraints: νΛCDM
constraints on Ωm and σ8. The SPTcl dataset
comprises SPT-SZ+WL+Yx, Planck is TT+lowTEB, KiDS+GAMA and DES Y1 are
cosmic shear+galaxy clustering+galaxy-galaxy-lensing. The WtG (X-ray selected
clusters) result also contains their fgas measurement. (This
is Figure 6 in Bocquet et al.
2019.)
|
| |
|
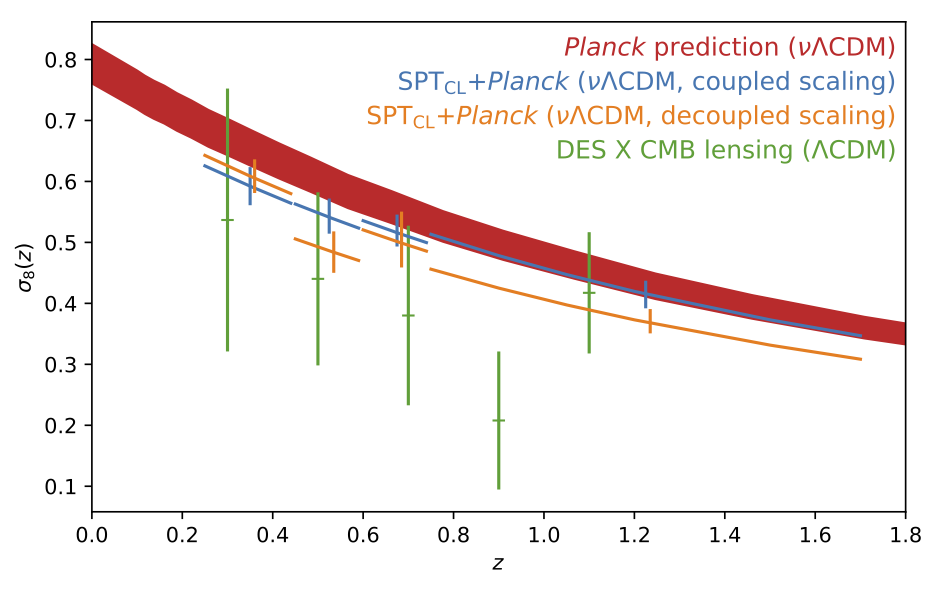
The evolution of σ8 as a function of redshift. The red
band shows the 1 sigma interval of the prediction obtained from
Planck in the νΛCDM cosmology. The blue data points are
obtained in a joint SPTcl+Planck analysis, where σ8(z) is
constrained only by the cluster sample. Orange data points are obtained
from a similar analysis that allows for more freedom in the SZ scaling relation
(see paper). The nearly horizontal error bars on the blue and orange data points
indicate the extent of the redshift bins and are shaped to follow the evolution
of σ8 in the νΛCDM model. For comparison, green
data points show constraints from the cross-correlation of the galaxy
density in the Dark Energy Survey with CMB lensing from SPT (Giannantonio et al.
2016). (This is Figure 14 in Bocquet
et al. 2019.)
|
|
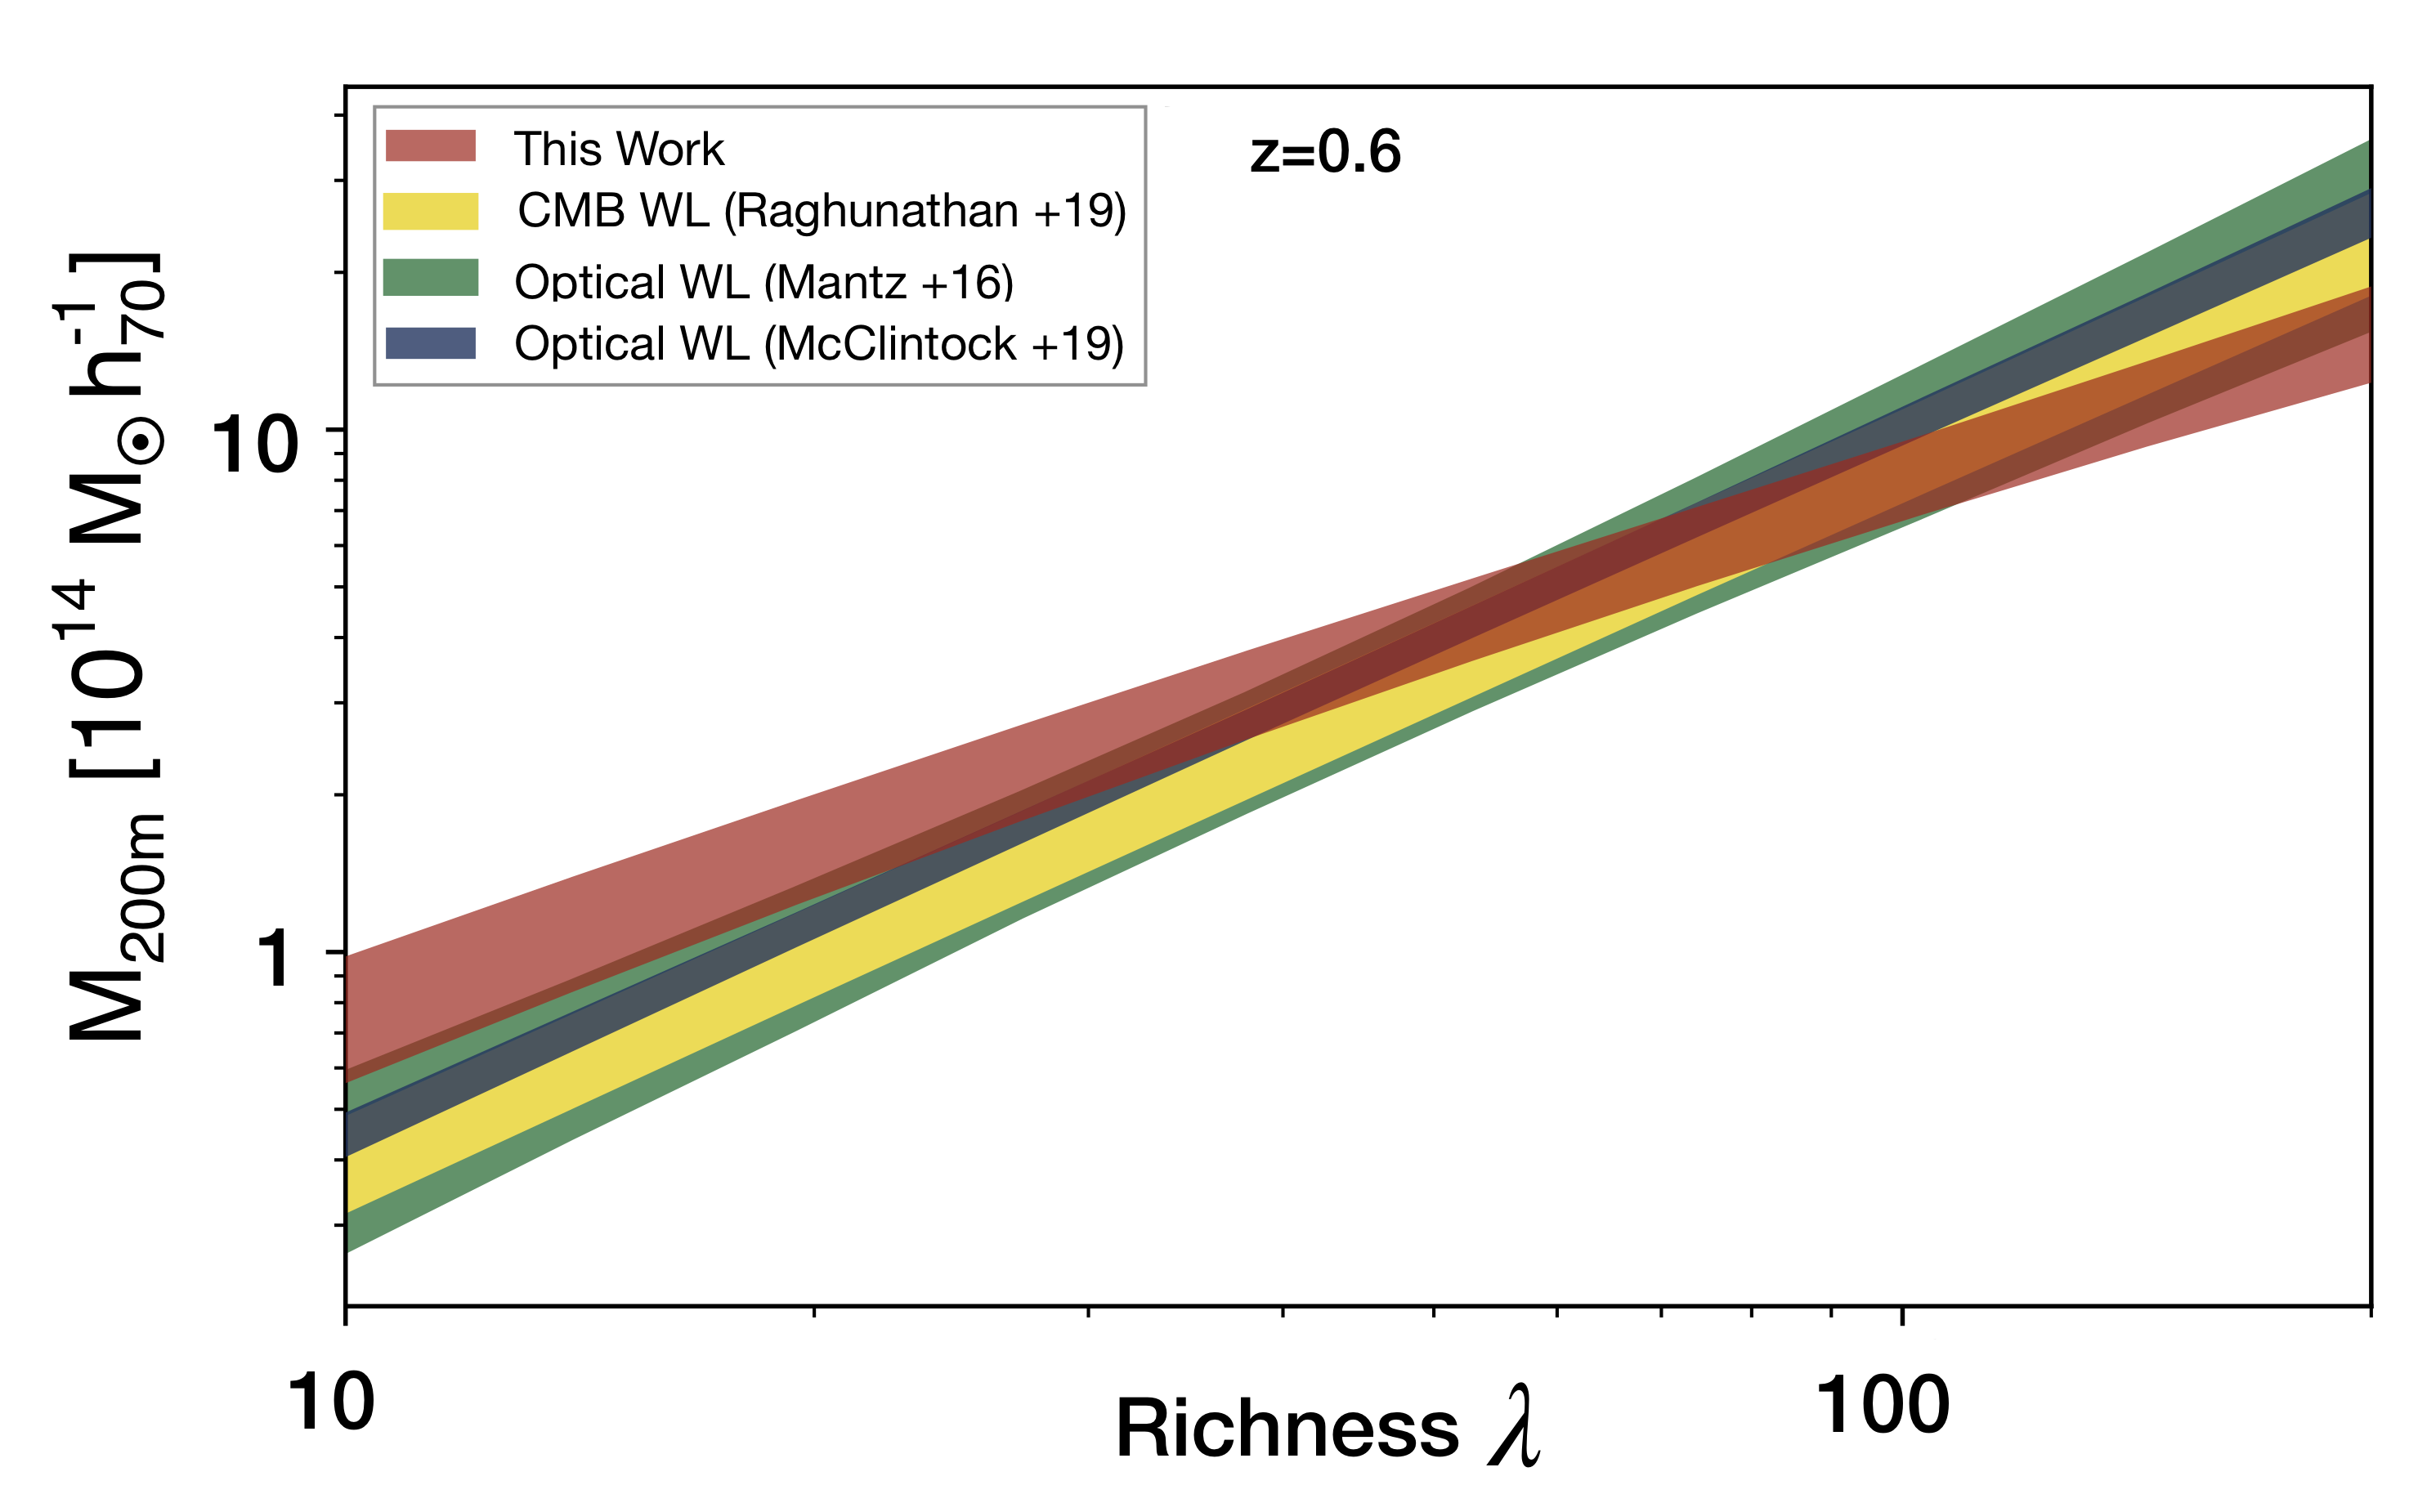
The mass-lambda relation from the SPT-DES redMaPPer volume-limted sample
evaluated for a fixed LCDM cosmology with Ωm = 0.3, h=0.7, and
σ8 = 0.8. We find the relation to be 28% shallower than
that from a weak-lensing analysis of the DES data (McClintock et
al. 2019)---a difference significant at the 4 sigma level---with the
relations intersecting at lambda = 60 . (This is Figure 11 in Bleem
et al. 2019.)
|
| |
|
Catalog Products |
|
|
|
| |
| Catalog |
Reference |
Description |
|
SPTpol Extended Cluster Survey catalog |
Bleem et al. (2019) |
For each cluster candidate we provide the position, the highest
detection significance in filtered SPT maps (and the core radii
corresponding to the detection), redshift information and—for each confirmed
cluster—a mass estimate. Where available we additionally
provide an optical richness from the RM algorithm in "scanning"
mode centered at the SPT location, the probability of false
association with the RM targeted galaxy overdensity, flag if the
estimated radio contamination exceeds 10% of the SZ signal, flag
identified strong gravitational lenses, and---if applicable---provide
lierature references for the strong lenses and spectroscopic
redshifts. Masses are determined using the best-fit
ξ-mass scaling relation for a flat LCDM cosmology with
Ωm = 0.3, h=0.7 and σ8 = 0.8. The
key to the imaging/redshift source is as follows: (1) Pan-STARRS1, (2) PISCO,
(3) DES, (4) Magellan/Fourstar, (5) Spitzer/IRAC, (6) WISE, (7)
literature photometric redshift, (8) spectroscopic redshift. |
|
SPTpol 100d catalog |
Huang et al. (2019) |
For each cluster candidate we provide the position, the highest
detection significance in filtered SPT maps (and the core radii
corresponding to the detection), redshift information and—for each confirmed
cluster—a mass estimate. Masses are determined using the best-fit
ξ-mass scaling relation for a flat LCDM cosmology with
Ωm = 0.3, h=0.7 and σ8 = 0.8. |
SPT-SZ 2500d catalog
(updated redshifts) |
Bocquet et al. (2019) |
Updated calibration of the photometric redshifts and additional
spectroscopic redshifts. We provide updated mass estimates using the
best-fit ξ-mass scaling relation for a flat LCDM cosmology with
Ωm = 0.3, h=0.7 and σ8 = 0.8, and mass
estimates marginalized over all scaling relation and cosmology parameters
from the weak-lensing calibrated cosmology analysis. |
|
Fiducial SPT-SZ 2500d catalog |
Bleem et al. (2015) |
For each cluster candidate we provide the position, the highest
detection significance in filtered SPT maps (and the core radii
corresponding to the detection), the integrated YSZ within a 0.75
arcmin aperture, redshift information and—for each confirmed
cluster—a mass estimate. Masses are determined using the best-fit
ξ-mass scaling relation for a flat LCDM cosmology with
Ωm = 0.3, h=0.7 and σ8 = 0.8. |
If you have any questions regarding these datasets or their use, please contact
Lindsey Bleem (lbleem_at_anl.gov),
Sebastian Bocquet (sebastian.bocquet_at_physik.lmu.de), or Nicholas
Huang (ndhuang_at_berkeley.edu).
|
| |
|
Quick Links |
|
|
|
| |
Papers
Bleem et al. 2019 The SPTpol Extended Cluster Survey here
Huang et al. 2019 Galaxy Clusters Selected via the
Sunyaev-Zel'dovich Effect in the SPTpol 100-Square-Degree
Survey here
Bocquet et al. 2019 Cluster Cosmology Constraints from the
South Pole Telescope 2500 deg2SZ Survey:Inclusion of Weak
Gravitational Lensing Data from Magellan and the Hubble Space
Telescope here
Bayliss et al. 2016 SPT-GMOS: A Gemini/GMOS-South Spectroscopic
Survey of Galaxy Clusters in the SPT-SZ Survey here
de Haan et al. 2016 Cosmological Constraints from Galaxy Clusters in
the 2500 square-degree SPT-SZ Survey here
Bleem et al. 2015 Galaxy Clusters Discovered via the Sunyaev-Zel'dovich Effect in the 2500-square-degree SPT-SZ survey here
Bocquet et al. 2015 Mass Calibration and Cosmological Analysis of the SPT-SZ Galaxy Cluster Sample Using Velocity Dispersion, σv, and X-ray YX Measurements here
Ruel et al. 2014. Optical Spectroscopy and Velocity Dispersions of Galaxy Clusters from the SPT-SZ Survey here
|
| |
|
|