|
Project Supported by
|
NSF, National Science Foundation
KICP, Kavli Institute for Cosmological Physics
USAP, United States Antarctic Program
Raytheon Polar Support Corporation
|
|
|
Related Websites
|
CBI, Cosmic Background Imager
DASI, Degree Angular Scale Interferometer
WMAP, Wilkinson Microwave Anisotropy Probe
|
|
|
|
 | Overview |
|
|
|
| |
This page provides data products associated with the SPT measurement of the millimeter-wavelength anisotropy power spectrum described in astro-ph/1111.0932, Reichardt et al 2011. The power spectrum is presented over the multipole range 2000 < ell < 9400 at 95, 150, and 220 GHz, and can be used to refine models of the Sunyaev-Zel'dovich effect and cosmic infrared background.
If you have any questions regarding this data set or its use, please contact Christian Reichardt (cr_at_berkeley_edu).
|
| |
| Figures |
|
 |
|
| |
| 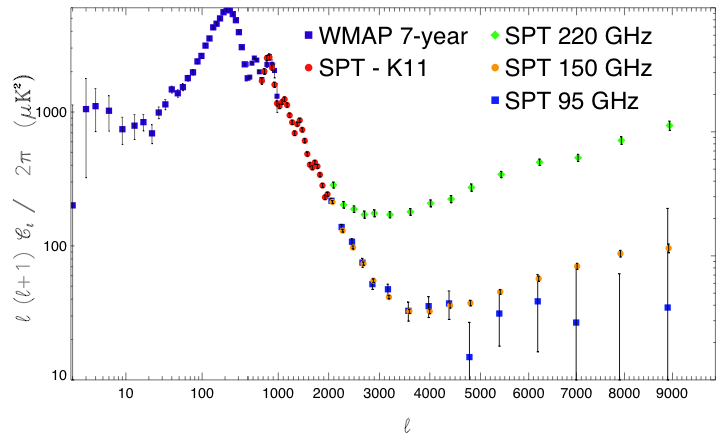 The SPT and WMAP7 bandpowers.
The SPT bandpowers at ell < 2000 are taken from K11 and 150 GHz only.
At ell > 2000, we show the bandpowers at 95, 150, and 220 GHz measured with the SPT in this work.
The bandpower errors shown do not include calibration uncertainties.
The SPT and WMAP7 bandpowers.
The SPT bandpowers at ell < 2000 are taken from K11 and 150 GHz only.
At ell > 2000, we show the bandpowers at 95, 150, and 220 GHz measured with the SPT in this work.
The bandpower errors shown do not include calibration uncertainties.
(This is the left panel of Figure 2 in Reichardt et al. 2011.)
|
| |
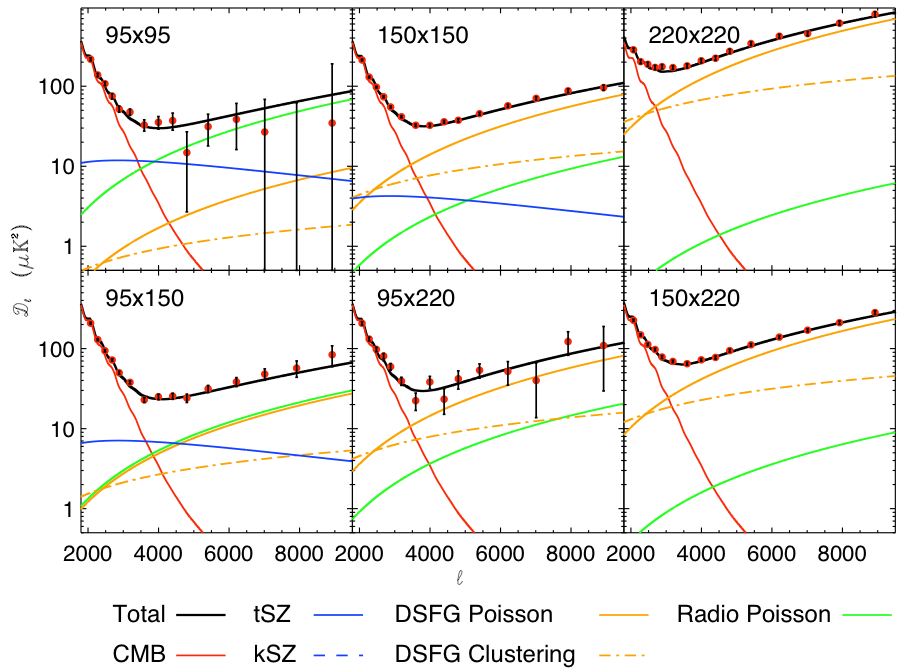 The six auto- and cross-spectra measured with the 3-frequency SPT data.
Overplotted on the bandpowers are the best-fit model for the fiducial set of model parameters.
Note that the bandpowers have not been corrected by the best-fit calibration or beam uncertainties in the MCMC chains.
In addition to the complete model (black lines), each individual model component is shown.
The thermal SZ effect is marked with the solid blue line.
The best-fit kSZ power is near-zero and off-scale.
The Poisson power from DSFGS and radio galaxies are shown by solid orange and green lines respectively.
The clustered component to DSFGs is shown with a dot-dash, orange line.
The six auto- and cross-spectra measured with the 3-frequency SPT data.
Overplotted on the bandpowers are the best-fit model for the fiducial set of model parameters.
Note that the bandpowers have not been corrected by the best-fit calibration or beam uncertainties in the MCMC chains.
In addition to the complete model (black lines), each individual model component is shown.
The thermal SZ effect is marked with the solid blue line.
The best-fit kSZ power is near-zero and off-scale.
The Poisson power from DSFGS and radio galaxies are shown by solid orange and green lines respectively.
The clustered component to DSFGs is shown with a dot-dash, orange line.
(This is Figure 3 in reichardt et al. 2011.)
|
| |
| |
| Bandpowers |
|
|
|
| |
These are the SPT bandpowers for 95x95, 95x150, 95x220, 150x150, 150x220, and 220x220 GHz from 2008+2009 observations. The bandpowers cover the multipole range 2000 < ell < 9400.
The bandpowers, covariances and window functions are here in a gzipped tarball.
A text file with the bandpowers for plotting can be found here .
Each row is one ell-bin. The columns are (1) lower bin edge, (2) upper bin edge, (3) bin center, (4) 95x95 bandpower, (5) 95x95 bandpower uncertainty, (6) 95x150 bandpower, (7) 95x150 bandpower uncertainty, (8) 95x220 bandpower, (9) 95x220 bandpower uncertainty, (10) 150x150 bandpower, (11) 150x150 bandpower uncertainty, (12) 150x220 bandpower, (13) 150x220 bandpower uncertainty, (14) 220x220 bandpower, (15) 220x220 bandpower uncertainty.
If you have any questions regarding this data set or its use, please contact Christian Reichardt (cr_at_berkeley_edu).
|
| |
| Likelihood Code |
|
|
|
| |
The code modules are here in a gzipped tarball. The files are intended to replace files for the May 2010 version of cosmomc with PICO installed.
If you have any questions regarding this data set or its use, please contact Christian Reichardt (cr_at_berkeley_edu).
|
| |
|
|


