|
Related Websites
|
CBI, Cosmic Background Imager
DASI, Degree Angular Scale Interferometer
Python experiment
WMAP, Wilkinson Microwave Anisotropy Probe
|
|
|
|
 | South Pole Site |
|
 |
|
| |
 Ground based astronomical observations at mm and sub-mm wavelengths place extreme requirements on the transmission and stability of the atmosphere. Steady atmospheric emission loads the bolometric detectors and adds photon noise, reducing overall sensitivity. Fluctuations in atmospheric brightness add noise to the detector timestream data as well. For these reasons high altitude sites, preferably with stable atmospheric conditions, are needed for ground based observations such as those targeted by the SPT.
Emission from the atmosphere consists of two components, one due to "dry air" which results from the wings of oxygen lines and a second component due to water vapor. The "dry air" component is well-mixed in the atmosphere and produces a signal that is only a function of elevation, commonly removed by beam switching. Water vapor, on the other hand, exhibits considerable variations in its density. These fluctuations in water vapor density result in spatial variations in the brightness of the sky.
|
| |
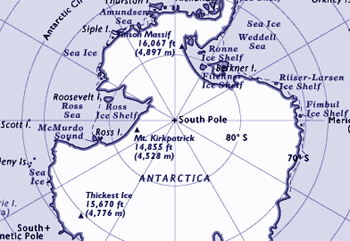
 The South Pole lies on the Antarctic Plateau, at an altitude of 2800 m. The average atmospheric pressure in the winter is 675 millibars. In addition, the low temperature at the South Pole reduces the water vapor content of the atmosphere, lowering both atmospheric emission and fluctuations in brightness. There is a long history of measuring atmospheric properties relevant to millimeter-wave observing at the South Pole; profiles of the atmospheric temperature, pressure, and water vapor have been measured at least once a day for several decades by the South Pole meteorology office, using balloon-borne radiosondes. Schwerdtfeger comprehensively reviewed the climate of the Antarctic Plateau, and found that the weather is bi-modal: 60% of the time the sky is clear with low precipitable water vapor (PWV) and weak katabatic winds (3 to 8 ms-1) emanating from the East Antarctic Plateau; 30% of the time is cloudy with higher PWV and stronger winds (6 to 10 ms-1) emanating from the Weddell Sea. Incidentally, the highest wind speed at the South Pole measured during continuous monitoring between 1957 and 1983 was only 24 m s-1, and for many months the wind speed did not exceed 12 m s-1. This low "maximum wind speed" is favorable from a telescope construction standpoint.
In addition to the meteorological measures, the millimeter and sub-millimeter opacity at the Pole has been measured by several experiments in the past decade. The results show that deep millimeter-wave observations are possible most of the time; the median winter PWV is only 0.25 mm as the air is dessicated by frigid temperatures (annual average: -49oC, minimum temperature: -82oC).
As mentioned previously, atmospheric stability is of extreme importance for our measurements. Spatial fluctuations in the brightness of the sky result in temporal noise in detector timestream data as the telescope moves the beam across the sky, or as the wind blows the atmosphere through the beam. As a function of angular scale, the power in atmospheric fluctuations is well described by a Kolmogorov spectrum and therefore falls rapidly with decreasing angular scale.
Lay and Halverson used observations made with the Python experiment operating at 40 GHz to characterize atmospheric fluctuations at the South Pole during the Austral summer. They compared the results of the Python experiment with the site testing interferometer at Chajnantor through fits to a parametric model and found that the amplitude of the sky noise at the South Pole in the summer is 10 to 50 times less than that at Chajnantor. More recently, the sky noise during the Austral winter at the South Pole was characterized in detail at frequencies of 150, 219, and 274 GHz by the ACBAR experiment. Bussman et al used the correlation between ACBAR detectors to characterize the atmospheric fluctuation power in the presence of detector noise over the entire winter. Using the water vapor opacity predicted by the modified ATM code, we compared the ACBAR results with those of the Python experiment and found that the median fluctuation power during Austral winter is approximately 20 times smaller than in the summer.
We have used atmospheric noise simulations normalized by the ACBAR measurements of atmospheric fluctuation power at the South Pole to simulate SPT scan strategies in the presence of such atmospheric noise. The combination of the observed atmospheric power, wind speed, and angular scale of interest was used to compute a minimum telescope scan speed below which the atmospheric noise becomes comparable to the detector noise. The excellent atmospheric noise properties at the Pole enable quite low scanning speeds (as low as 2'/s) with only a small impact on our science goals; this has in turn allowed the very clean SPT optical design which relies on telescope scanning (rather than a moving mirror) to move the array response across the sky.
|
| |
|
|