|
Project Supported by
|
NSF, National Science Foundation
KICP, Kavli Institute for Cosmological Physics
USAP, United States Antarctic Program
Antarctic Support Contract (ASC)
DOE Office of Science High Energy Physics
|
|
|
Related Websites
|
CBI, Cosmic Background Imager
DASI, Degree Angular Scale Interferometer
WMAP, Wilkinson Microwave Anisotropy Probe
Planck
|
|
|
|
 | Figures |
|
 |
|
| |
|  Footprint of the SPT-3G survey plotted with those of several other
multi-wavelength surveys discussed in this work. The footprints are
overlaid on a dust map from Planck. (Fig. 1 of Bleem+26).
Footprint of the SPT-3G survey plotted with those of several other
multi-wavelength surveys discussed in this work. The footprints are
overlaid on a dust map from Planck. (Fig. 1 of Bleem+26).
|
| |
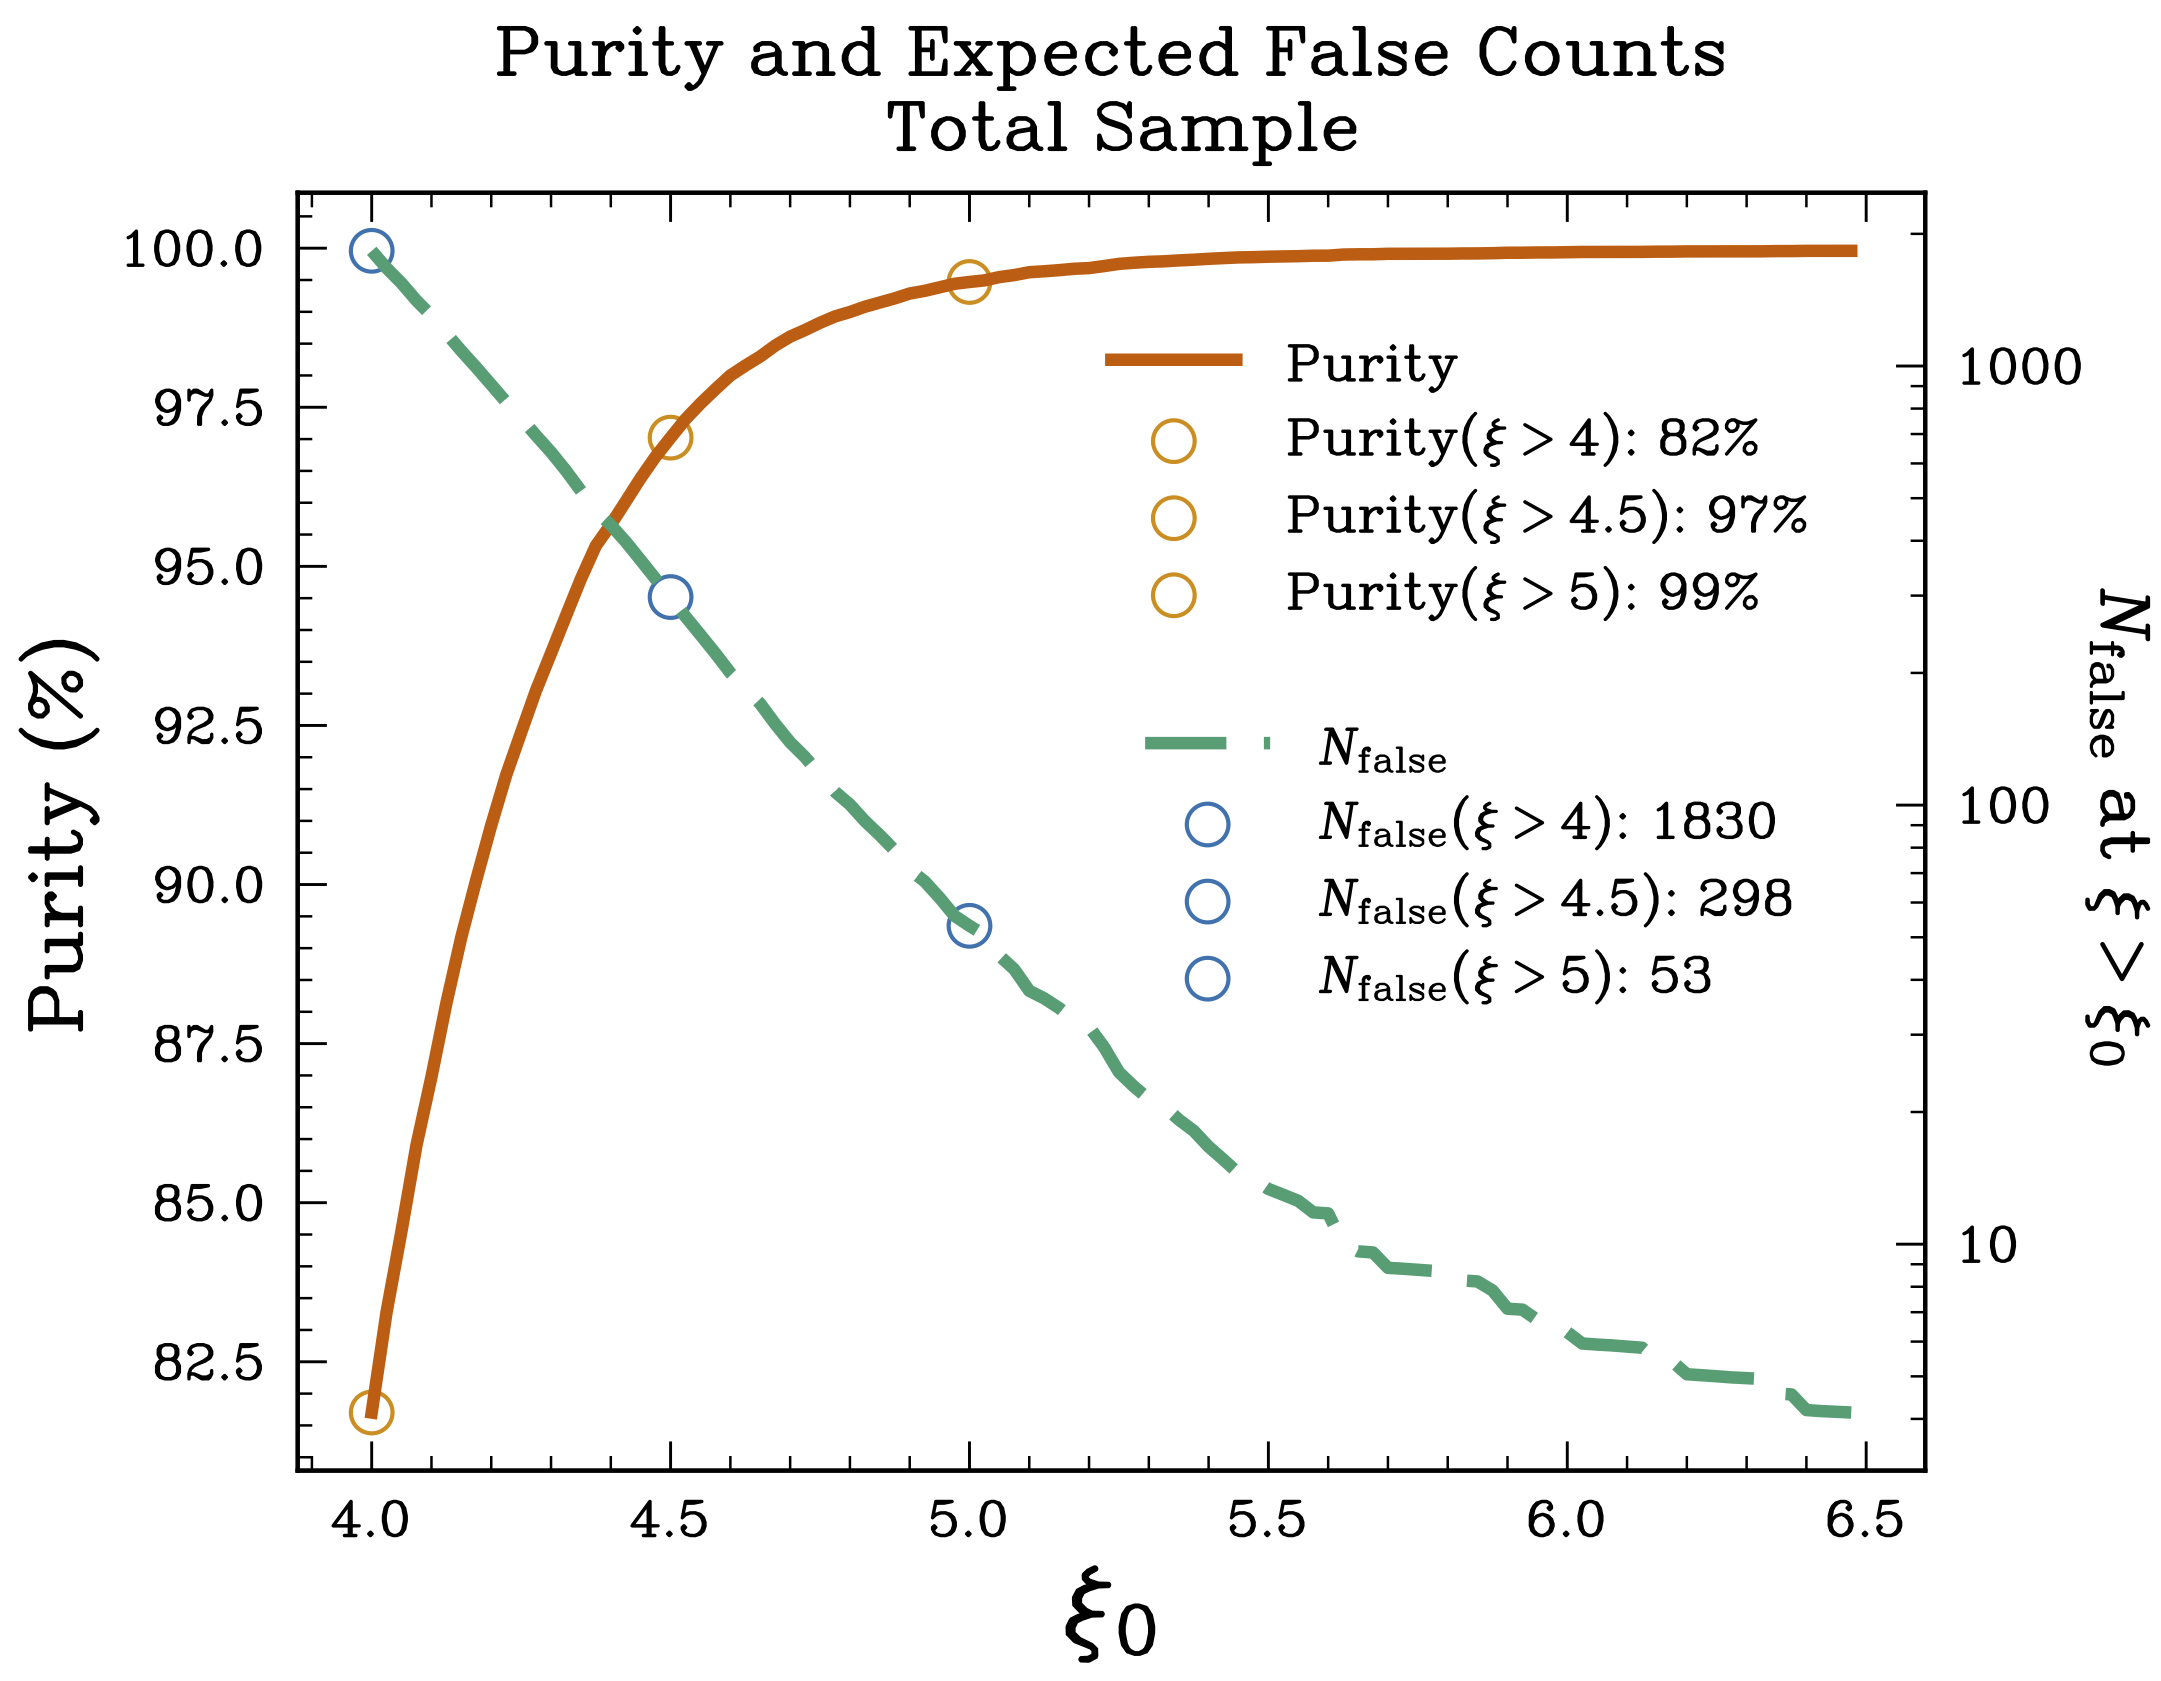 The expected purity (orange) and number of false detections (green) for the SPT-3G Main field cluster catalog as a function of minimum xi without additional optical follow-up. (Fig. 4 of Bleem+26).
|
| |
| |
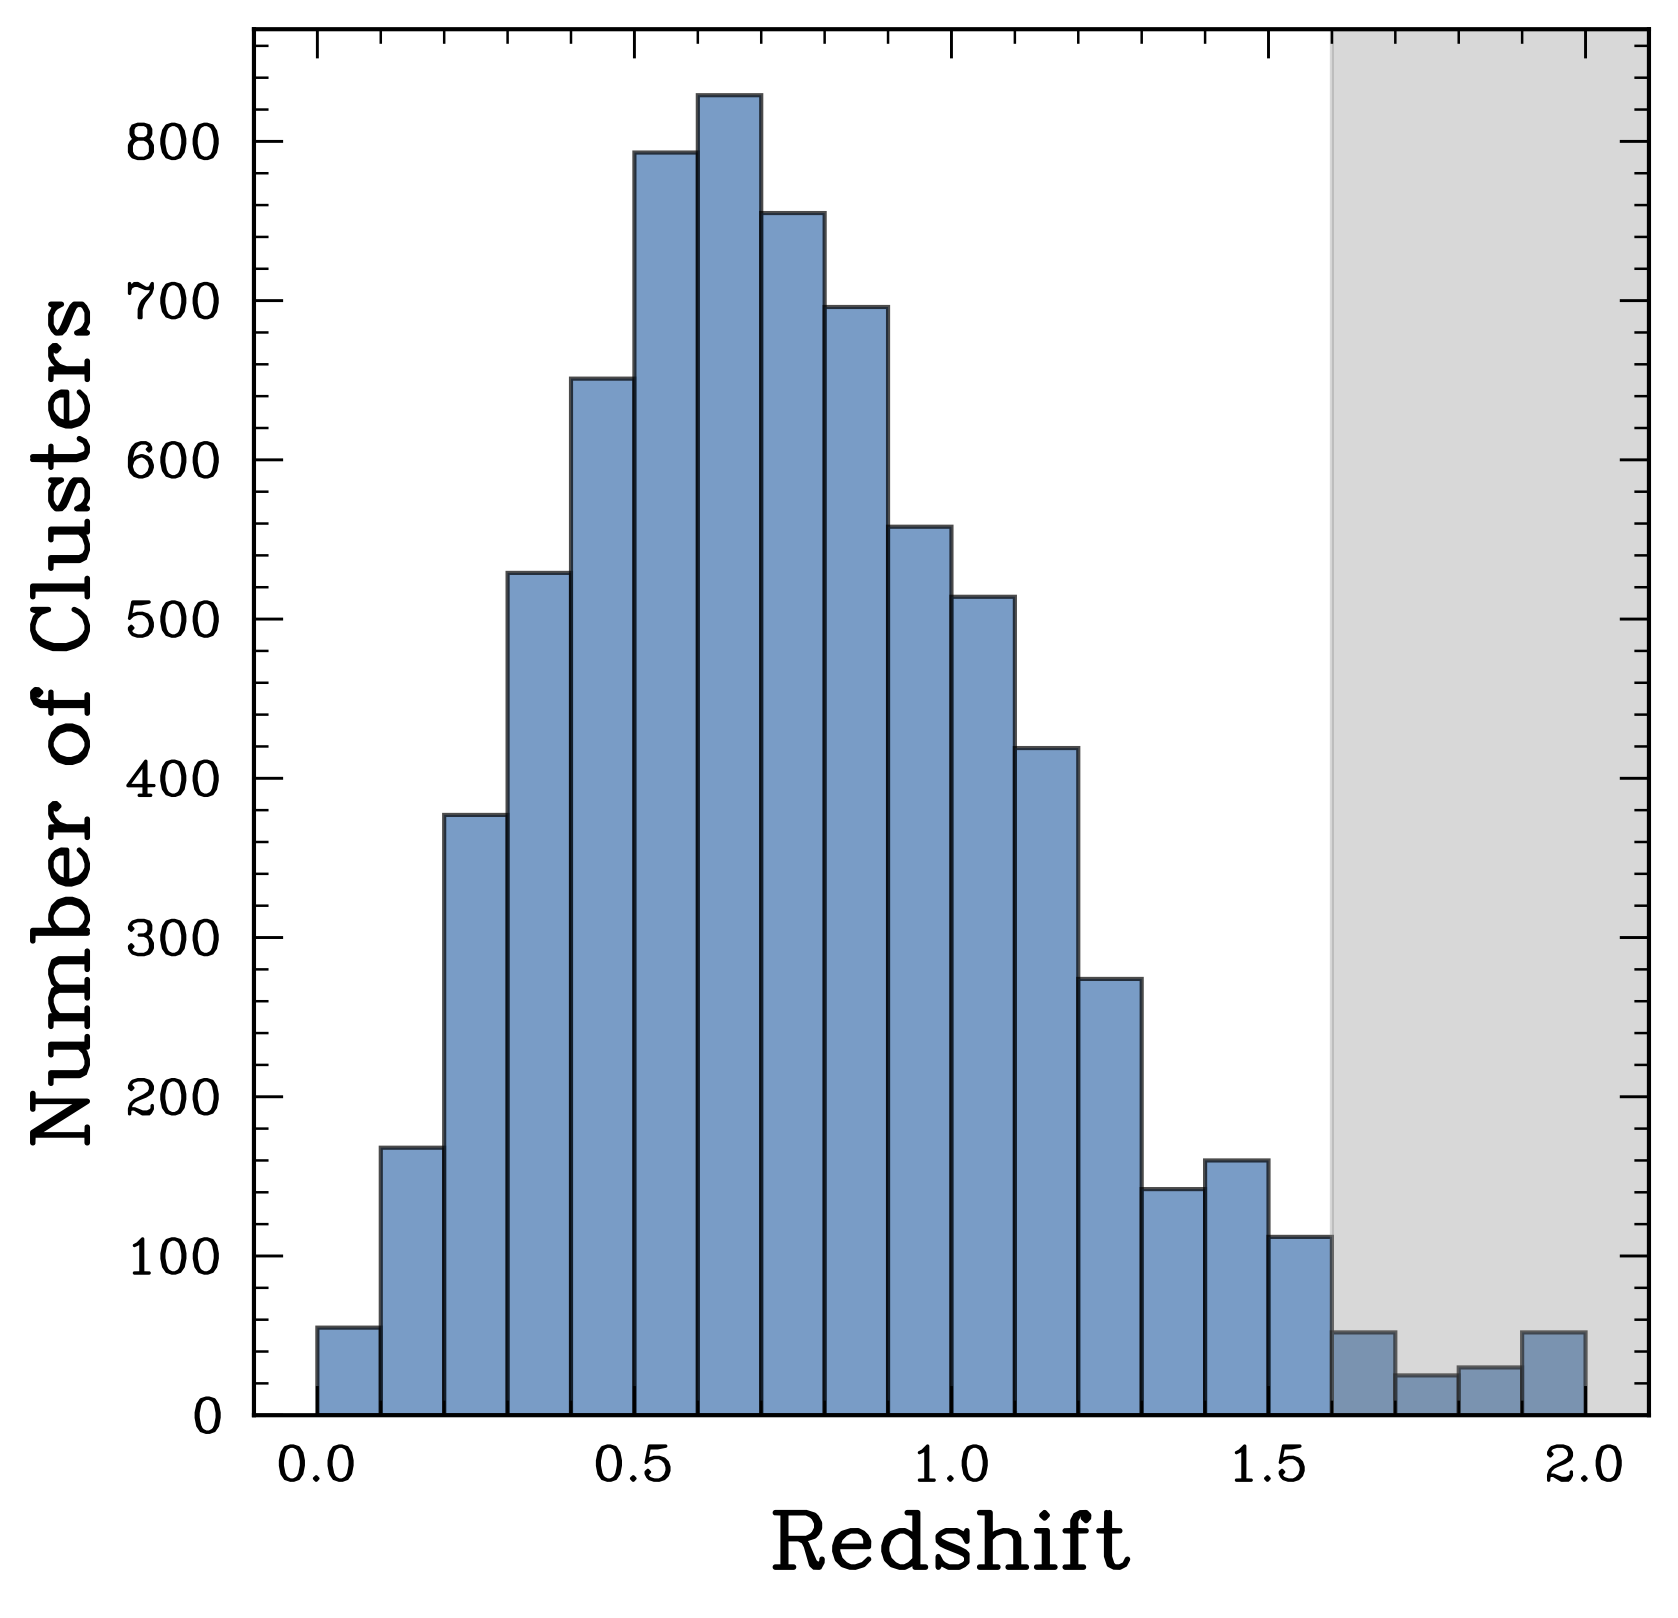 Redshift distribution of the confirmed clusters in the SPT-3G Main field sample confirmed using optical-IR data. (Fig. 8 of Bleem+26).
|
| |
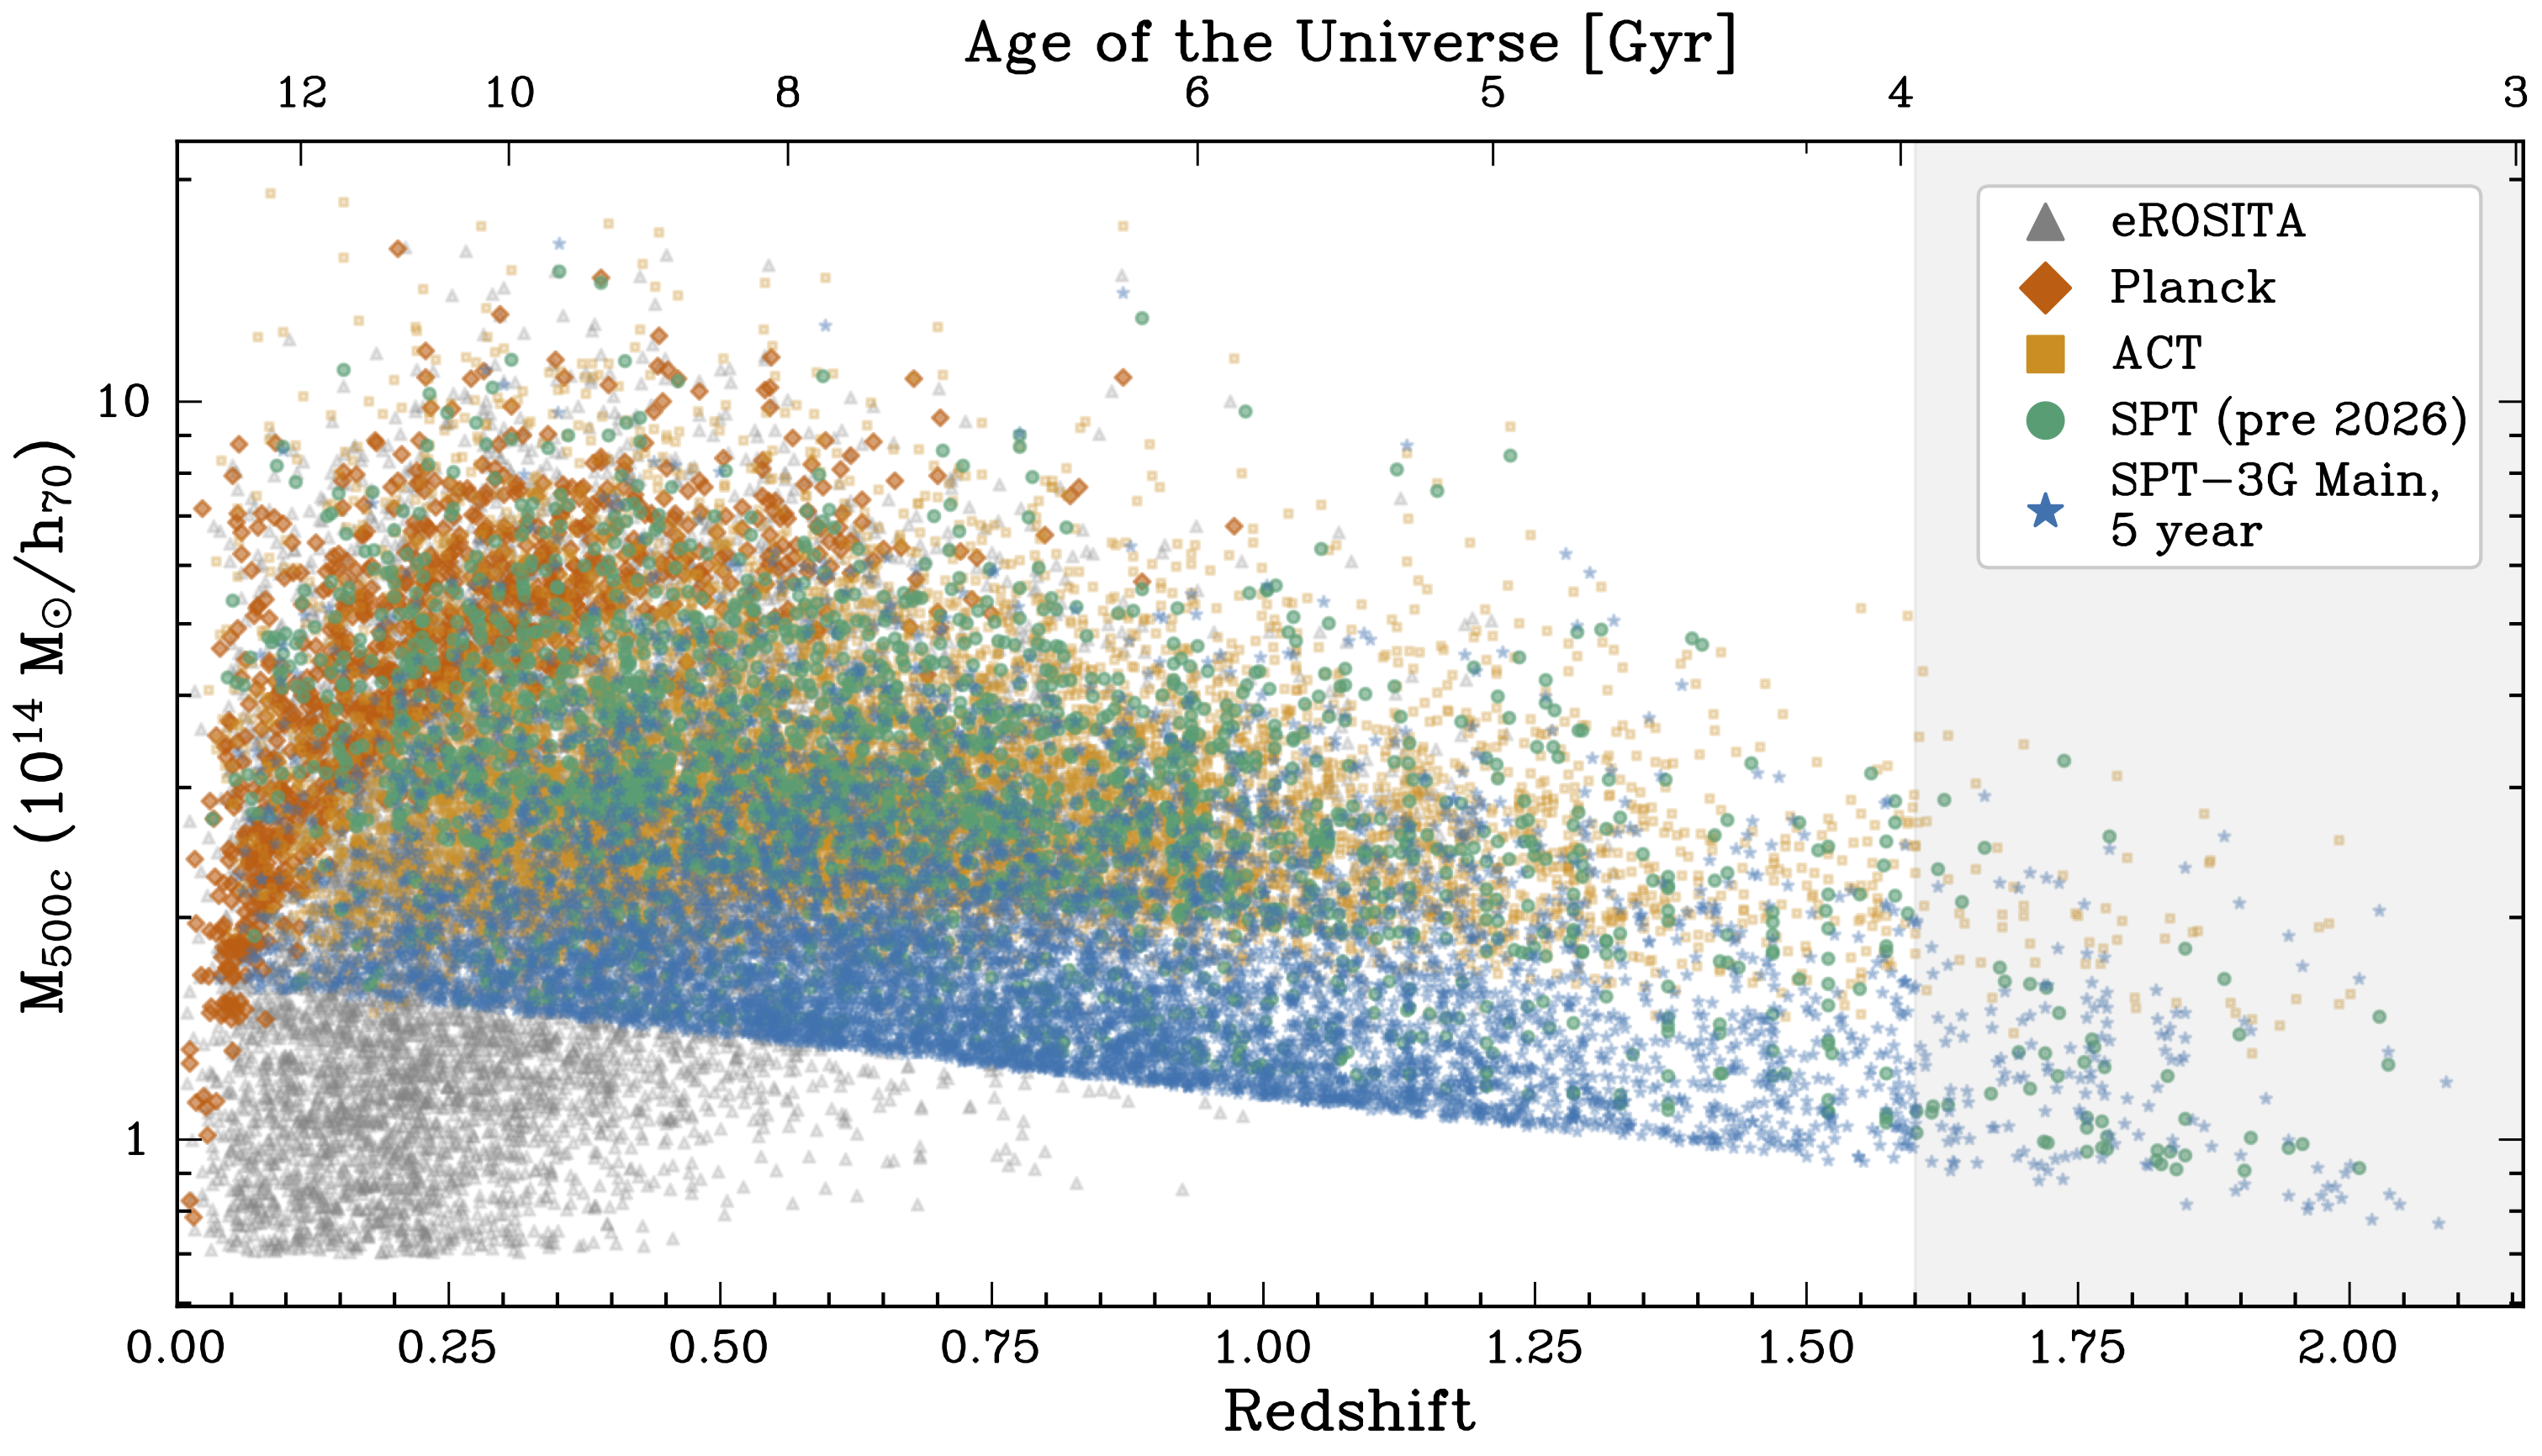 The mass-redshift distribution of the five-year SPT-3G Main field sample compared to other recent large ICM-selected cluster samples. (Fig. 11 of Bleem+26).
|
| |
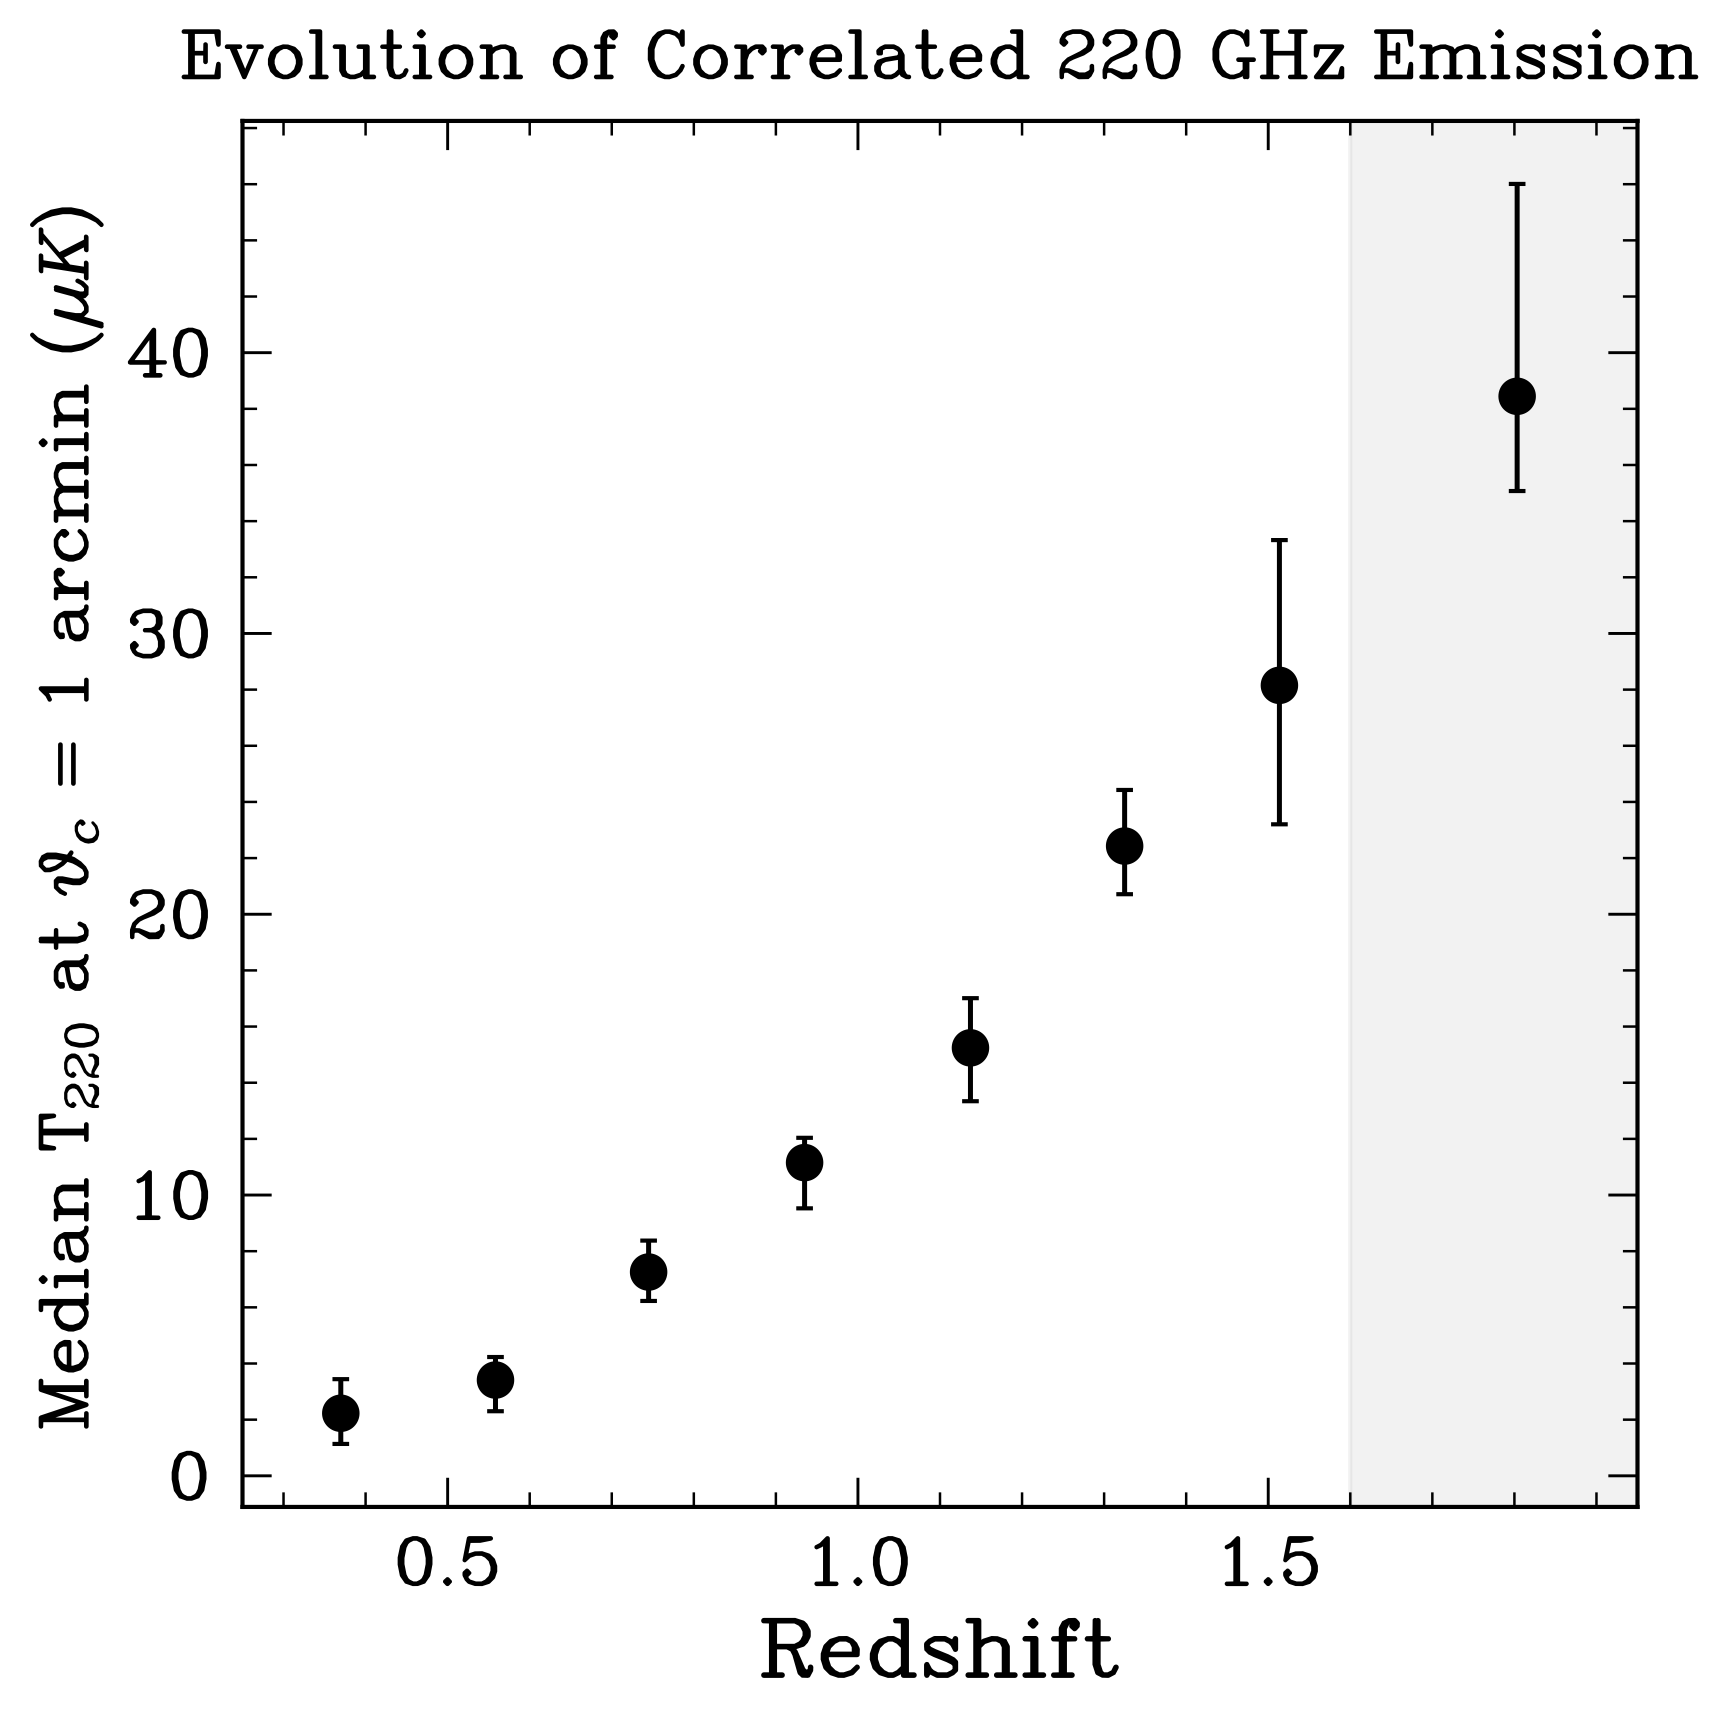 Redshift evolution of the median correlated 220 GHz emission at SPT-3G
cluster locations; this emission increases by over an order of
magnitude over the redshift range probed by the SPT sample (0.25 < z
<2), while the median Compton-y value in each bin is comparable. (Fig. 16 of Bleem+26).
Redshift evolution of the median correlated 220 GHz emission at SPT-3G
cluster locations; this emission increases by over an order of
magnitude over the redshift range probed by the SPT sample (0.25 < z
<2), while the median Compton-y value in each bin is comparable. (Fig. 16 of Bleem+26).
|
| |
|
|


