|
Project Supported by
|
NSF, National Science Foundation
KICP, Kavli Institute for Cosmological Physics
USAP, United States Antarctic Program
Antarctic Support Contract (ASC)
DOE Office of Science High Energy Physics
|
|
|
Related Websites
|
CBI, Cosmic Background Imager
DASI, Degree Angular Scale Interferometer
WMAP, Wilkinson Microwave Anisotropy Probe
Planck
|
|
|
|
 | Products |
|
|
|
| |
All data products are downloadable from this Argonne National Laboratory box link.
Data products include:
1) CMB temperature maps at 95 and 150 GHz (in standard FITS format with WCS information in the header).
2) An apodization mask for the above maps, as well as the "pixel mask" that defines the cluster search region. Same format as maps, but no WCS information in the header.
3) Estimates of the noise power spectral density for these maps. Same dimensions and size as the maps, but for the corresponding Fourier-space pixels. Note that these are technically ASDs (in units of Kcmb-radians, not Kcmb^2-sr).
4) An analytic approximation of the transfer function combined with measurements of the SPTpol beams. Same format as the noise psds. Note that a transfer function appropriate for power spectrum estimation of the SPTpol data will be released in an upcoming work (Chou et al., in prep).
5) A list of locations masked during the map making process (these locations will have a different transfer function than the rest of the map). In a plain text file.
6) The SPTpol 500d SZ Cluster catalog in fits format.
|
| |
| Figures |
|
 |
|
| |
| 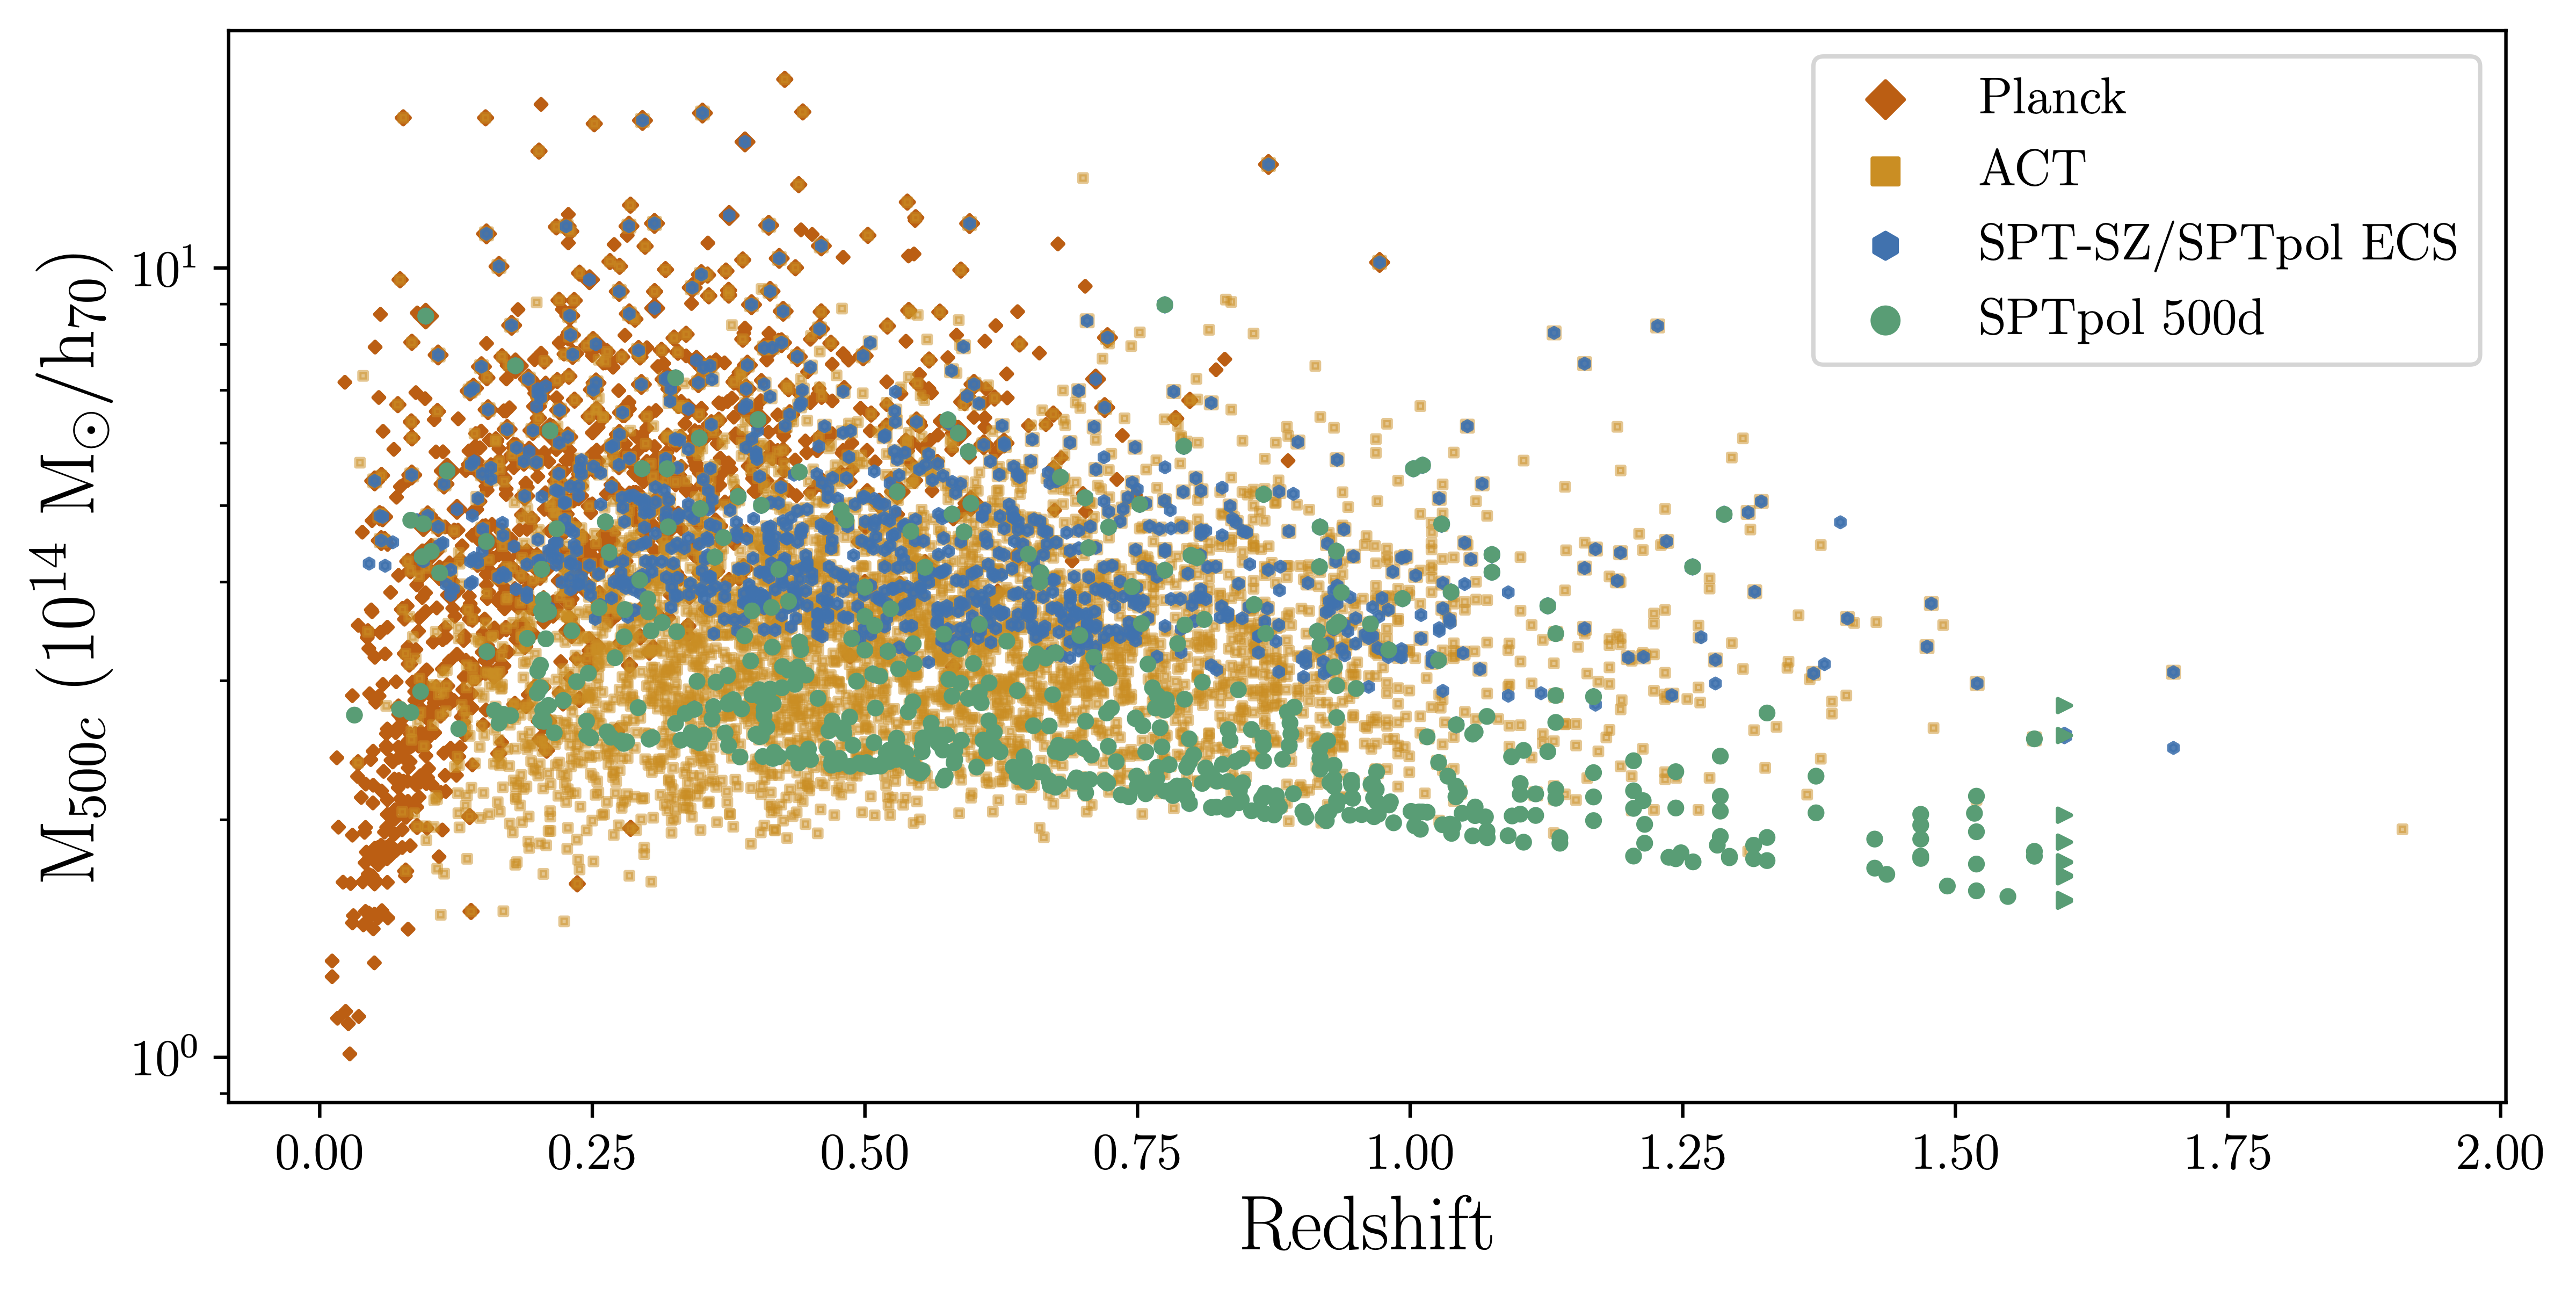 The mass-redshift distribution of the SPTpol 500d cluster sample. Plotted for comparison are wide-field SZ cluster samples from Planck, ACT, and SPT-SZ/SPT-ECS. The SPTpol sample consists of 544 clusters, with 21% of the sample at z > 1. Redshifts for clusters confirmed in Spitzer and WISE data at z >= 1.6 are considered lower limits. These systems are plotted as right-facing triangles in the plot.
|
| |
| |
| |
|
|


