Individual figures are available in PDF or JPG format here. Below we show the two main figures.
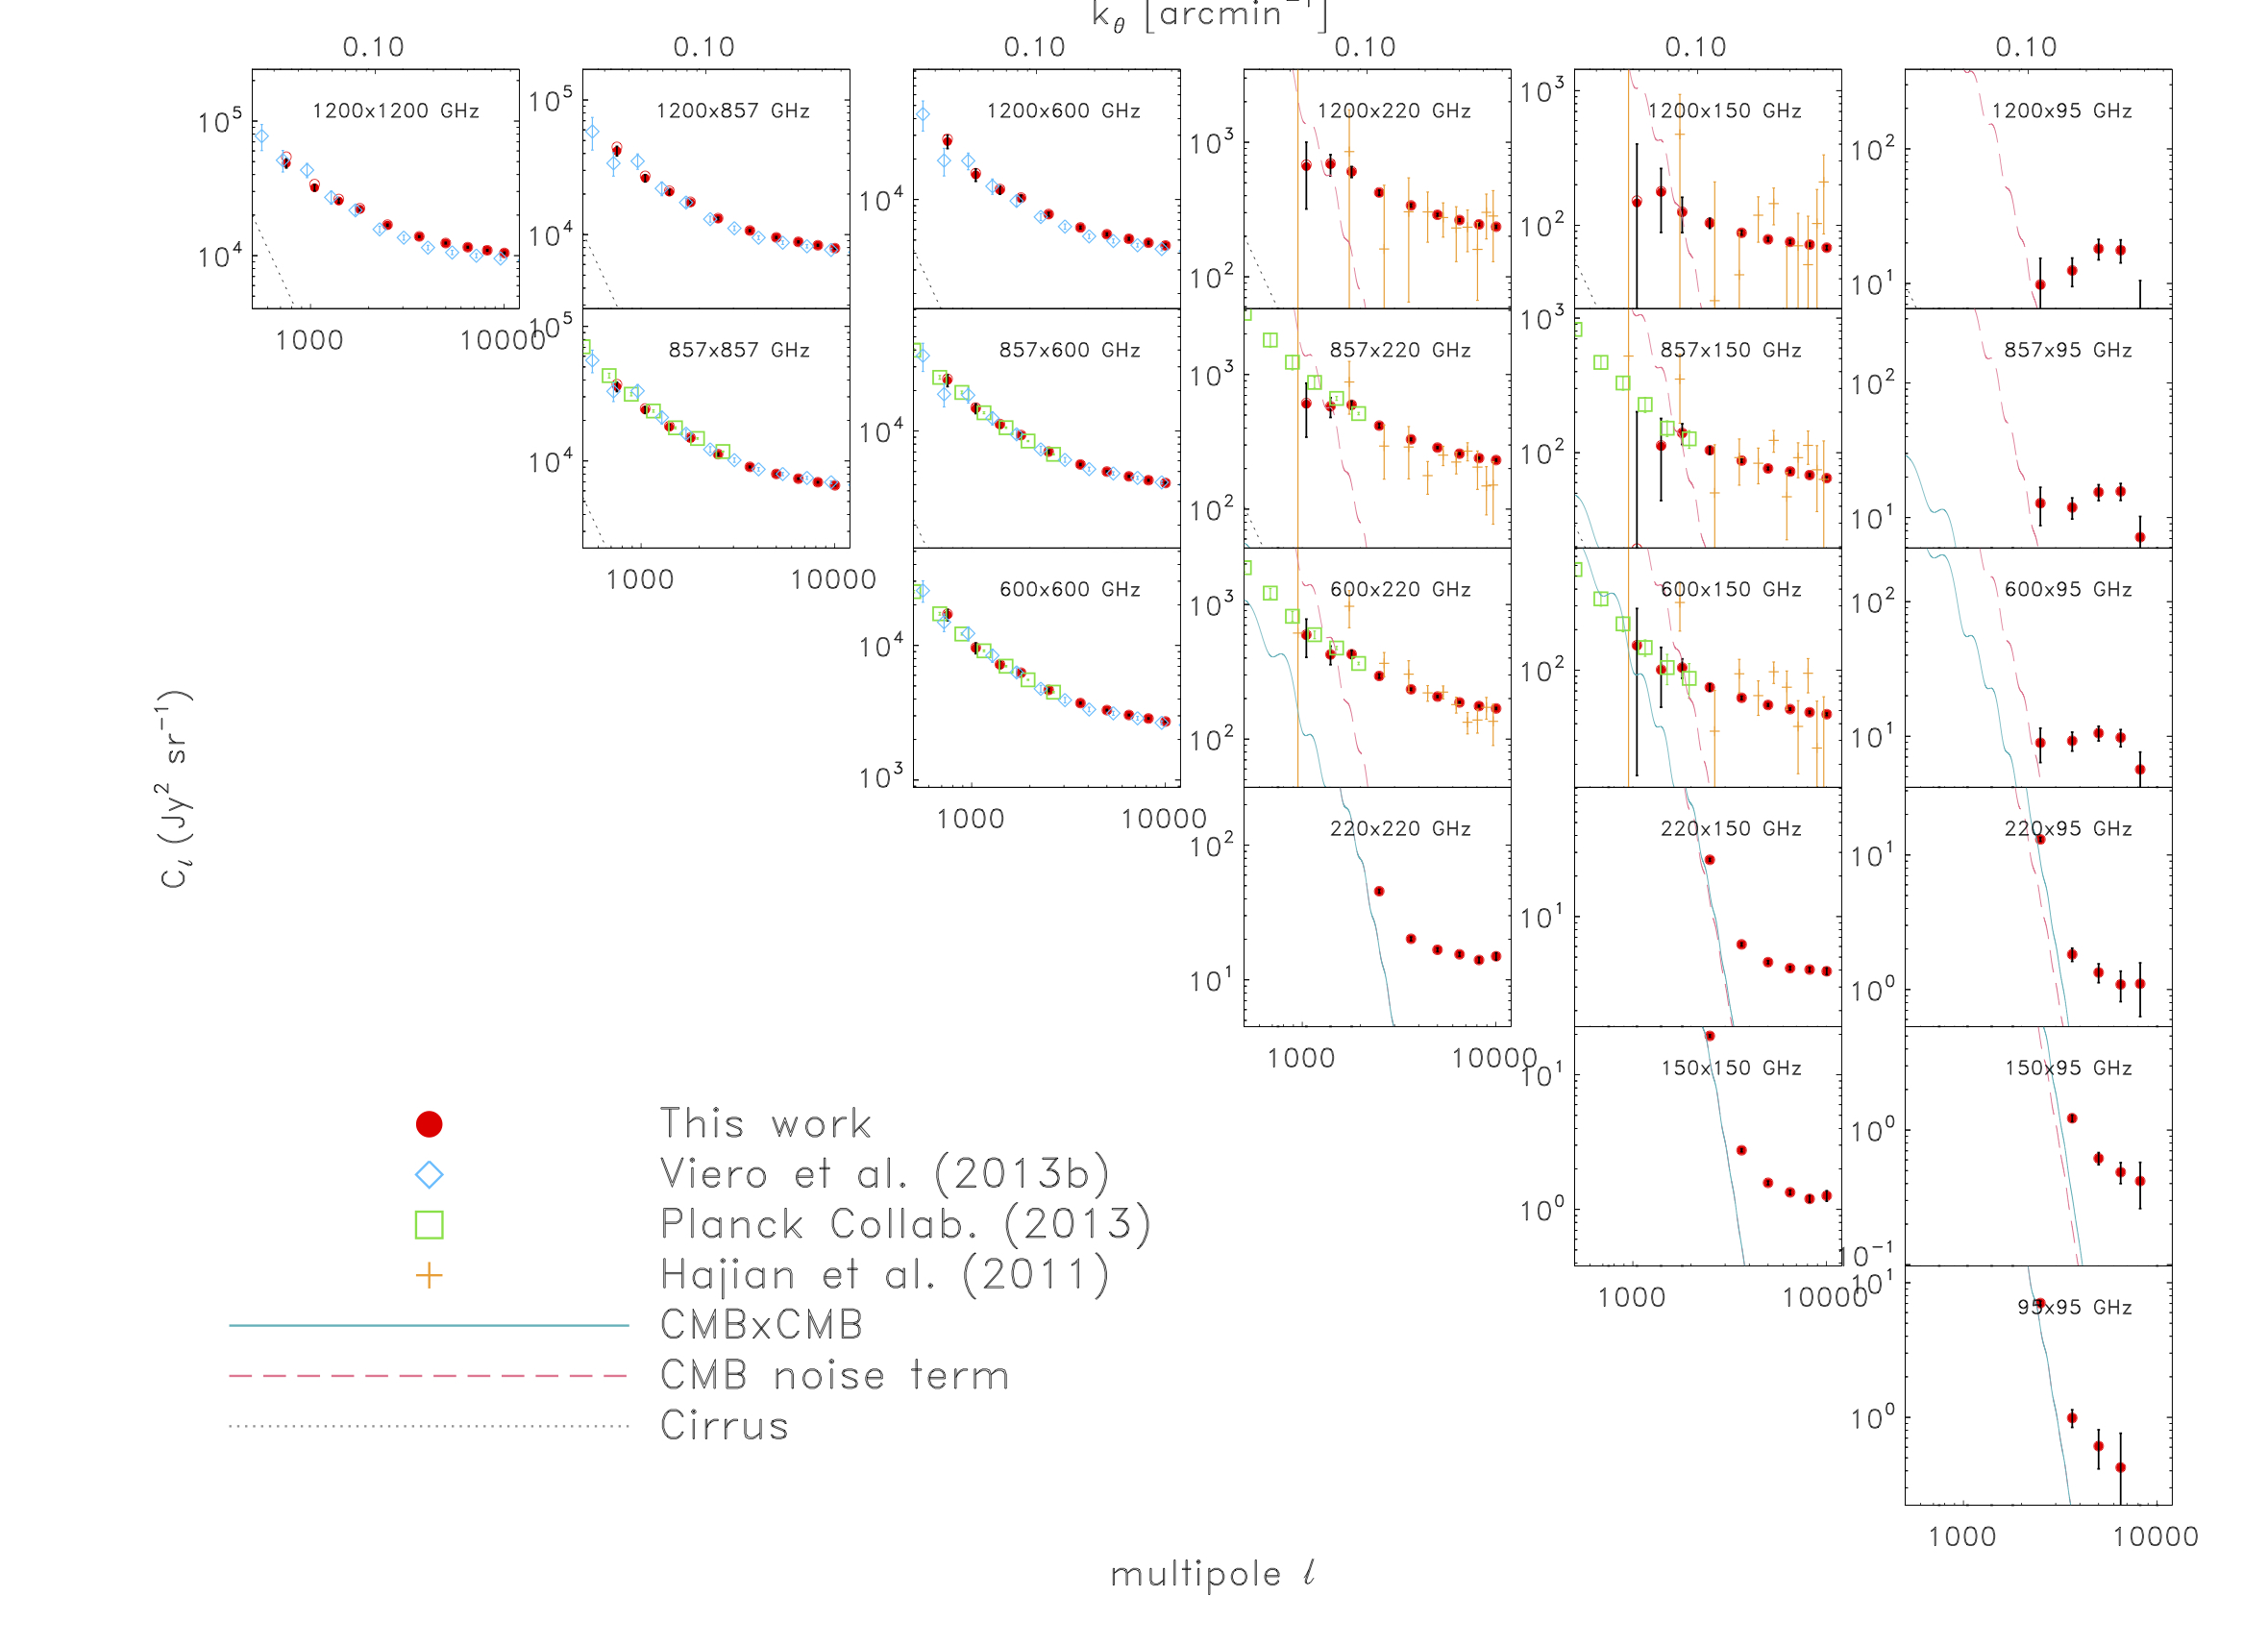
Fig. 1: Auto- and cross-frequency power spectra of the sky (solid red circles with black error bars), after accounting for mode-coupling, transfer function and instrumental beams. Bright point sources have been masked and an estimate of the Galactic cirrus power subtracted. The largely occluded open circles show the results before cirrus-subtraction. Gray dashed lines show the modelled level of Galactic cirrus in each cross-spectrum, while light blue lines show the expected CMB power. The variance due to the CMB (shown by the red, dashed line) can be higher, since it includes a term that scales with the CMB power in each band as well as the cross-spectrum. The plotted error bars are derived from the diagonal of the covariance matrix, as described in Section 2.3.3; there are significant correlations between bandpowers. Also shown are measurements from Viero et al. (2013a, blue diamonds), Hajian et al. (2012, orange crosses), and the Planck Collaboration et al. (2014, green squares). Note that to compare Planck data at 143, 217, 353, 545, and 857 GHz to that of SPIRE/SPT at 150, 220, 600, and 857 GHz, the Planck values are multiplied by 0.423, 1.64, 1.32, and 0.98 respectively.
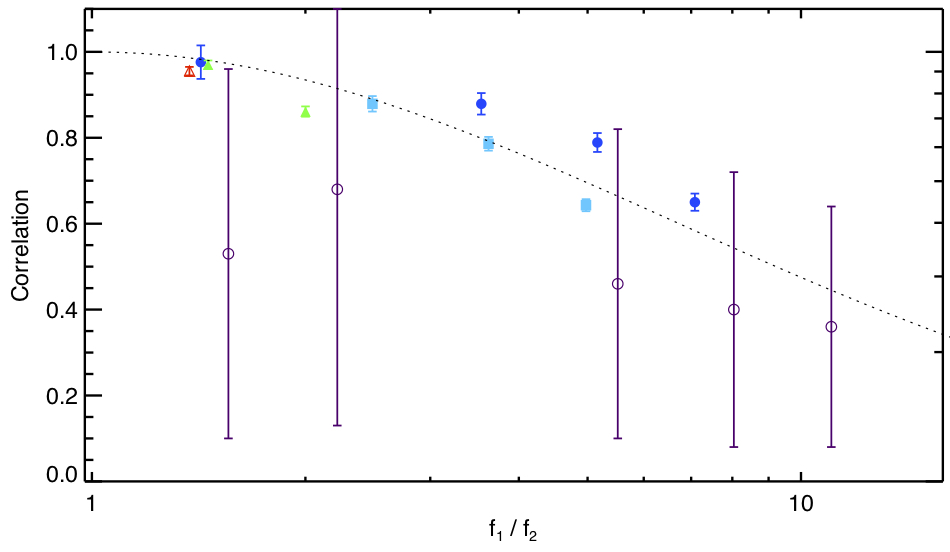
Fig. 3: The measured correlation between bands declines quickly as the frequency separation increases. The plot shows the correlation coefficients, as defined in Eqn. 3, averaged across l \in [2000,7000] as a function of ratio of the frequency for each band. The dotted line shows a toy model prediction for this correlation if the # in the modified black-body for each CIB galaxy is drawn from a Normal distribution with # = 0.53. While the toy model is a poor fit to the measured correlation coefficients (chisq = 109 for 14 d.o.f.), it does capture the qualitative behavior of the correlation coefficient. Frequency pairs where the lower frequency band is 95 GHz are marked by open purple circles, 150 GHz by filled blue circles, 220 GHz by filled turquoise squares, 600 GHz by filled green triangles, and 857 GHz by a open red triangle.
|


