|
Project Supported by
|
NSF, National Science Foundation
KICP, Kavli Institute for Cosmological Physics
|
|
|
Related Websites
|
WMAP, Wilkinson Microwave Anisotropy Probe
|
|
|
|
 | Overview |
|
|
|
| |
This page provides data products associated with the SPT measurement of the millimeter-wavelength angular bispectrum described in Crawford et al (2013). The bispectrum is recorded in mode triplet bins centered at [l1,l2,l3] of width delta(l)=200. Measurements are presented in three observing bands centered at 95, 150, and 220 GHz and with three levels of galaxy cluster masking: no clusters masked, clusters above M200(rho_crit)=8e14 Msun/h masked, and clusters above M200(rho_crit)=3e14 Msun/h masked.
For use in fitting the measured bispectrum to models, we also provide the theoretical predictions for the thermal SZ bispectrum at 150 GHz (one template for each of the three levels of cluster masking) and the beam realizations used in constructing the systematic covariance matrix. We also present the statistical-only, systematic-only, and statistical-plus-systematic parameter covariance matrices for each level of cluster masking.
If you have any questions regarding this data set or its use, please contact Tom Crawford (tcrawfor_at_kicp.uchicago.edu).
|
| |
| Figures |
|
 |
|
| |
| 
| 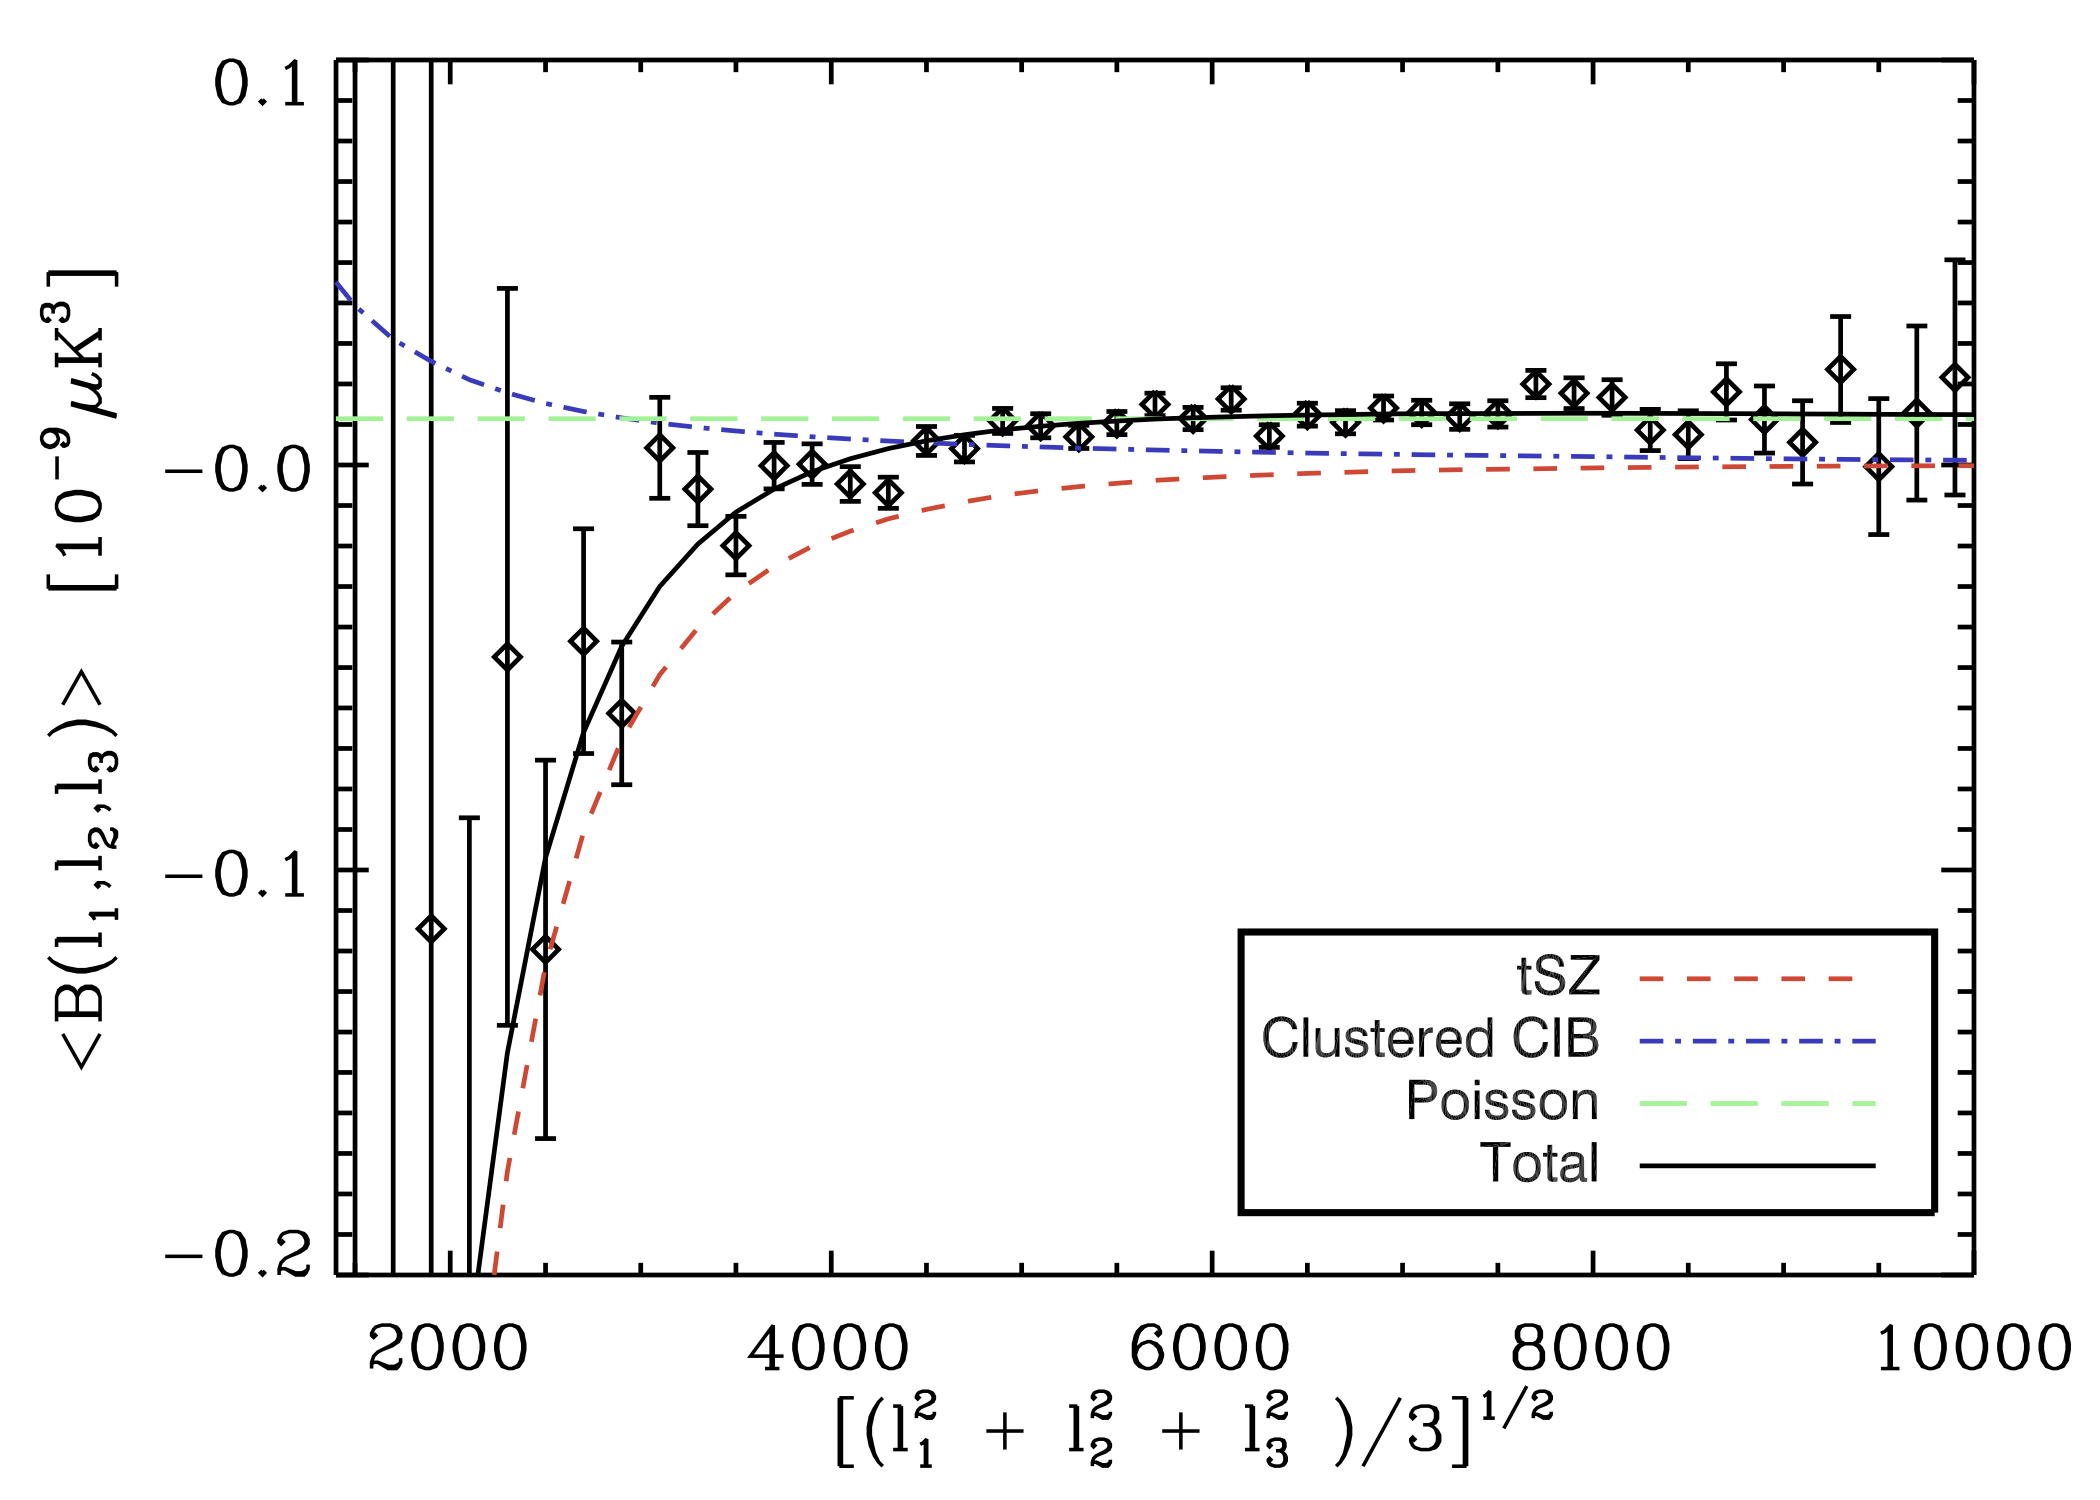
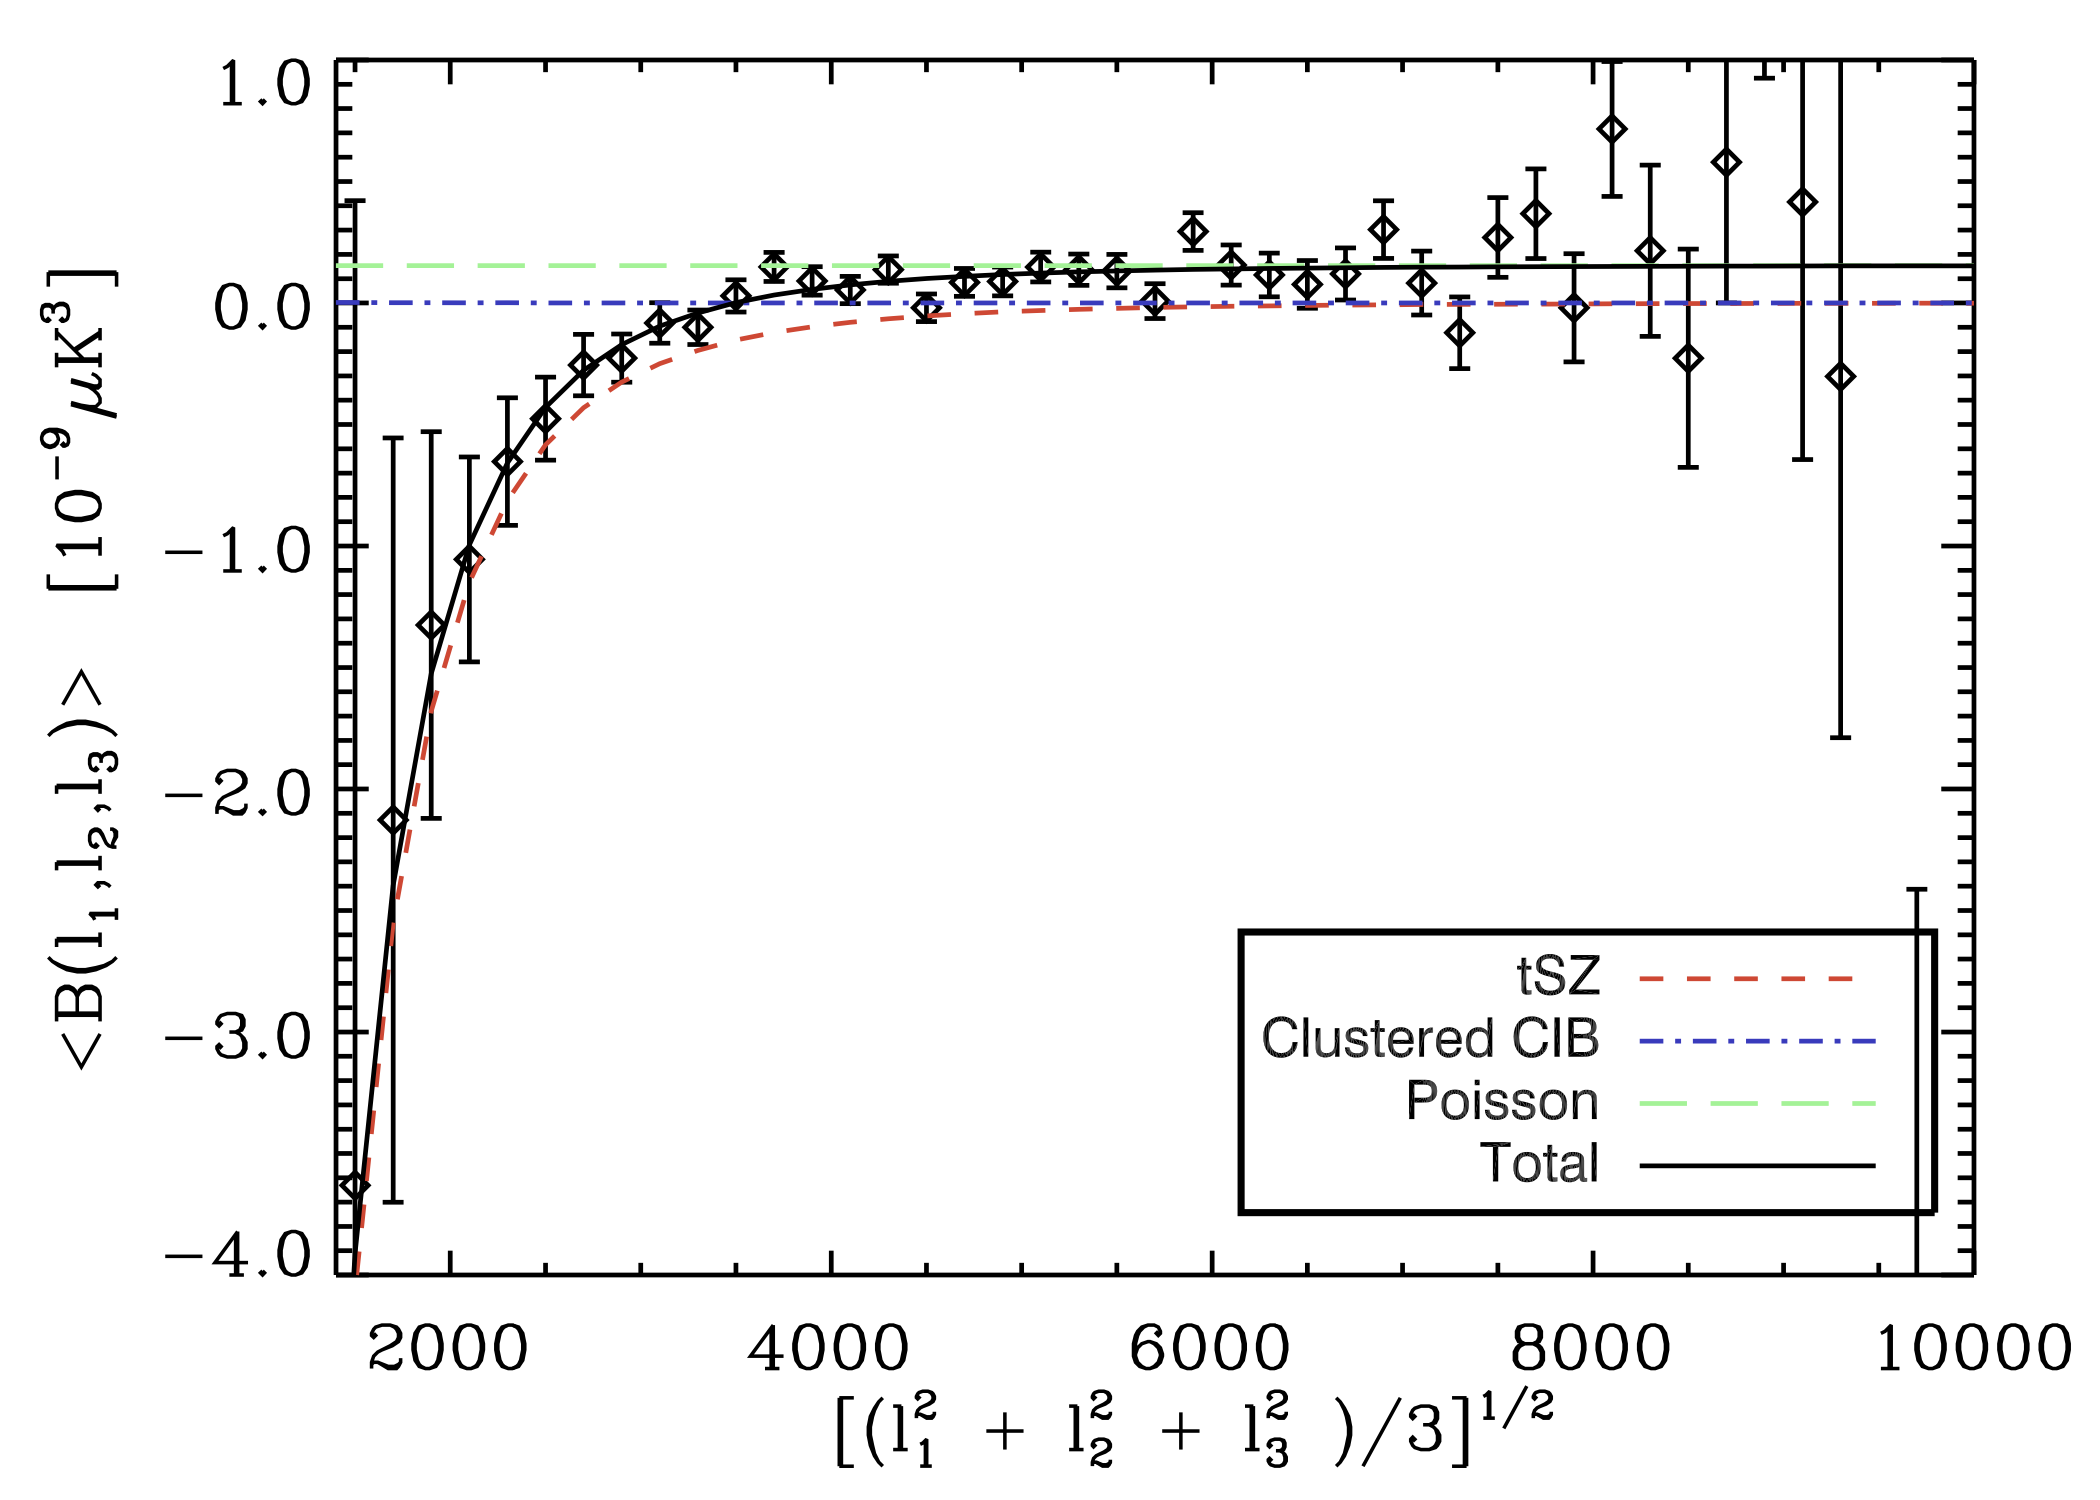
| 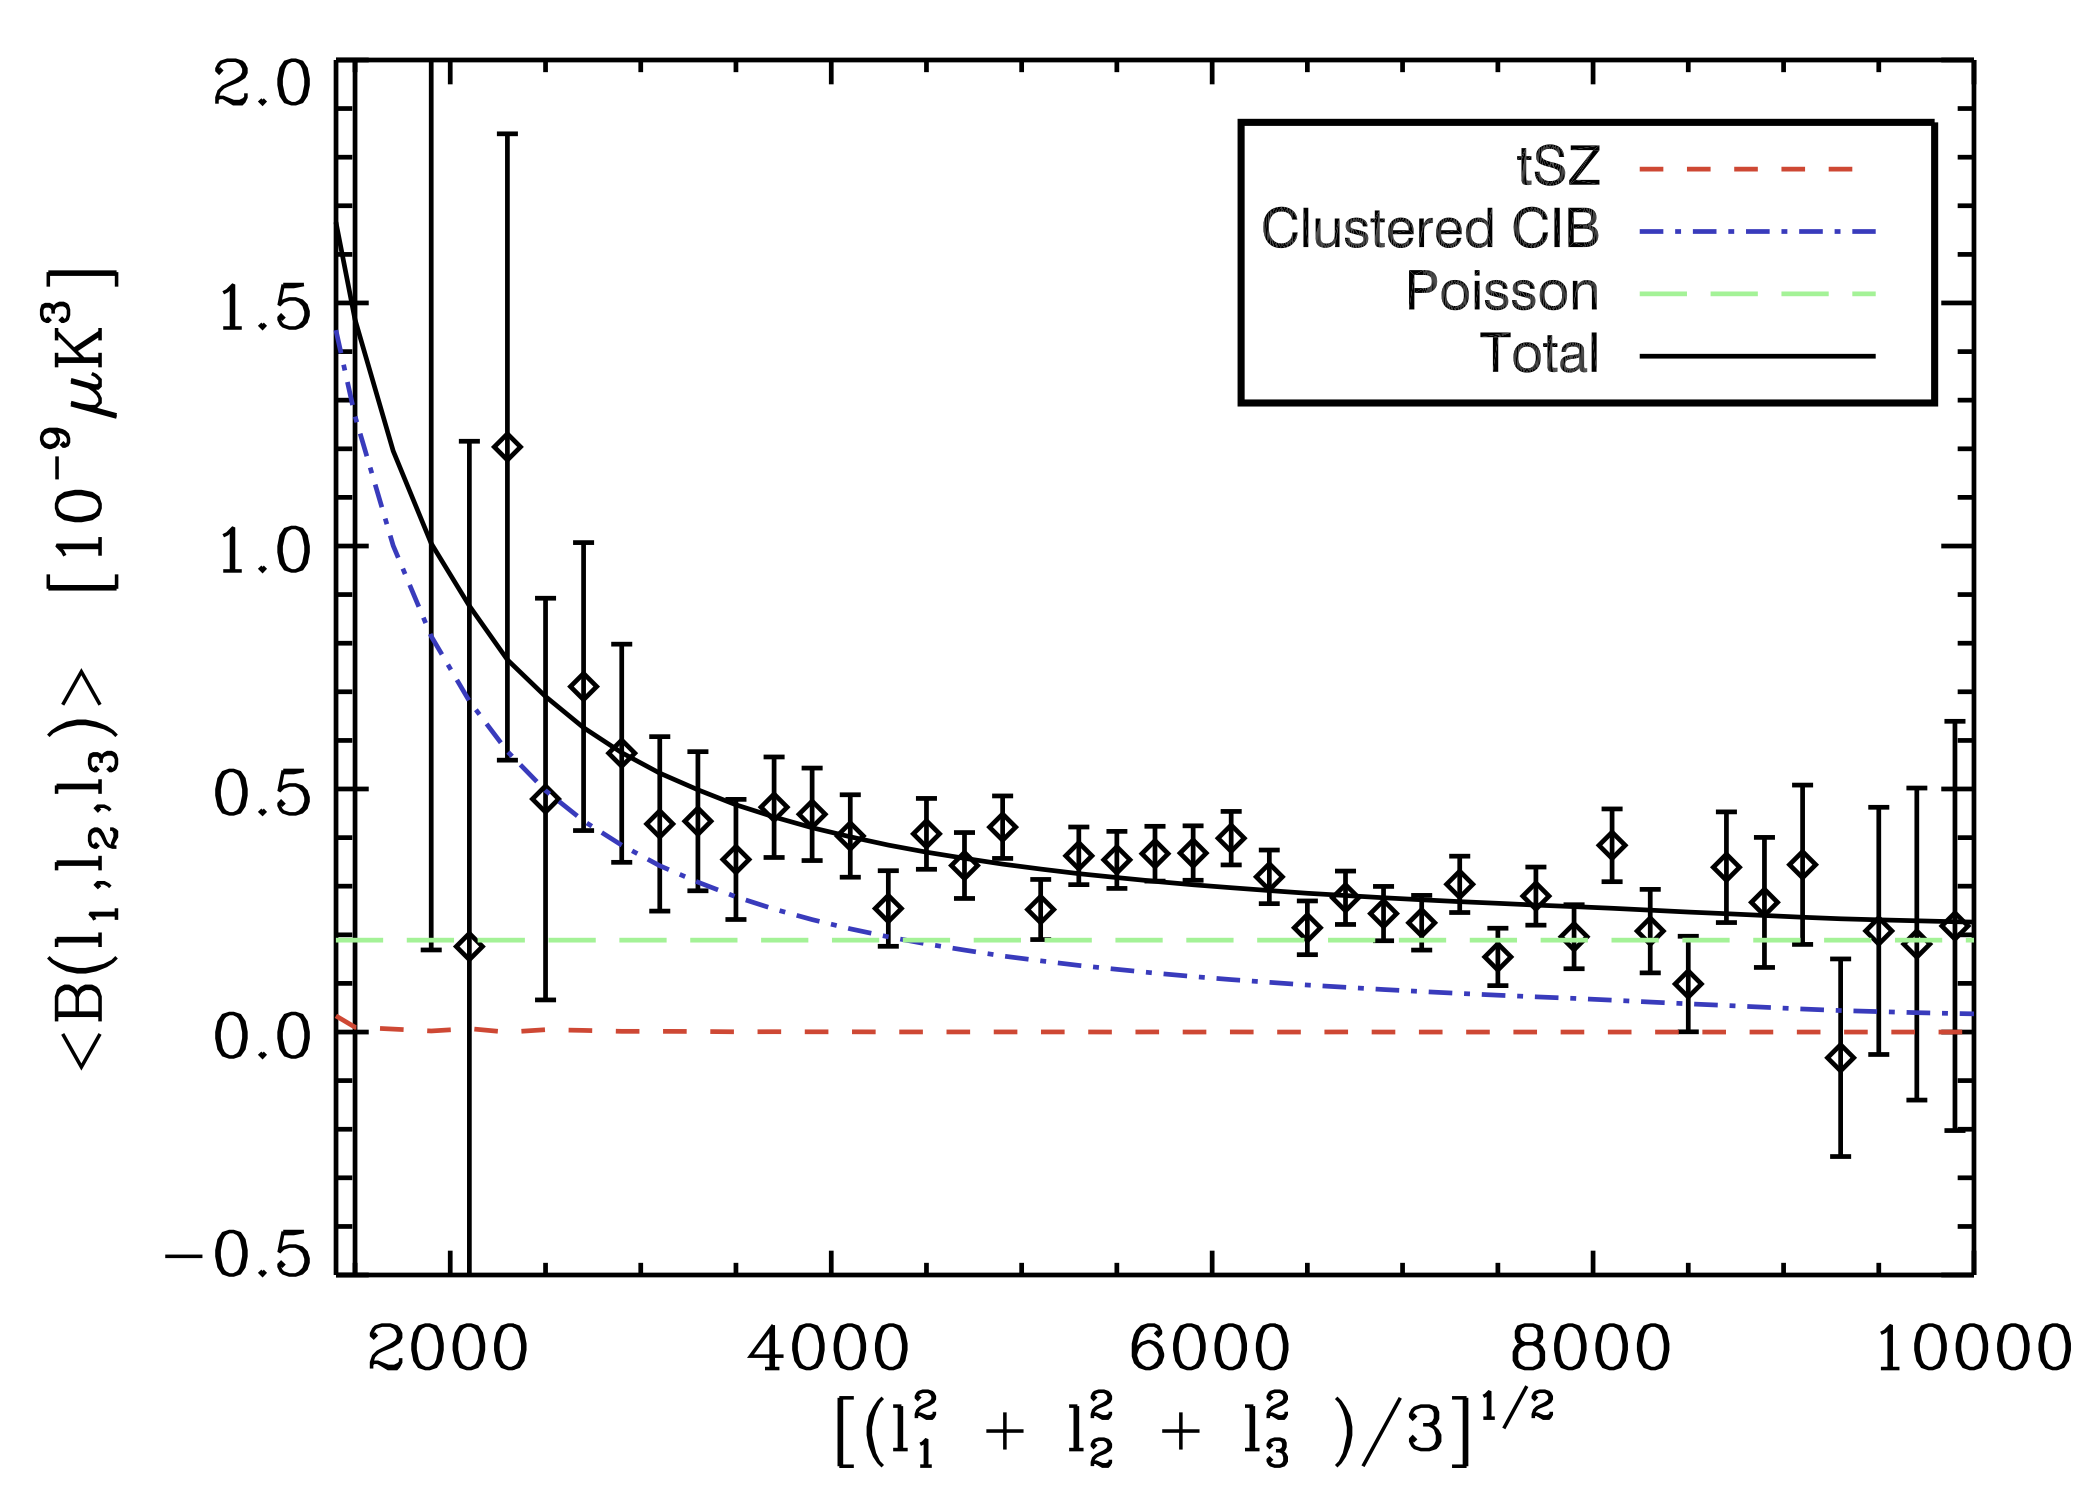 The bispectrum at 95, 150, and 220 GHz, with best-fit models overplotted.
The bispectrum errors shown do not include systematic or sample-variance uncertainties.
The bispectrum at 95, 150, and 220 GHz, with best-fit models overplotted.
The bispectrum errors shown do not include systematic or sample-variance uncertainties.
(These are the three panels of Figure 1 in Crawford et al. 2013.)
|
| |
| |
| Binned Bispectrum Measurements |
|
|
|
| |
These files contain the bispectrum measurements and associated covariance matrices (statistical only) at 95, 150, and 220 GHz from 2008+2009 observations. The bispectrum bins have width delta(l)=200 in all three dimensions and cover the angular frequency range 300 < l < 11000. The bispectrum is assumed to have no covariance between bins, but we do include covariance in a given bin between observing bands. The bispectrum and covariance are reported for three different levels of cluster masking (no clusters masked, clusters above M200(rho_crit)=8e14 Msun/h masked, and clusters above M200(rho_crit)=3e14 Msun/h masked).
The bispectrum values and covariances for each level of cluster masking are in a single ascii file. For each bispectrum bin (a total of 15,670 bins with nonzero weight), the file contains the center l value for each of the three sides of the (l1,l2,l3) triangles in that bin, the value of bispectrum (in units of uK_cmb^3) at 95, 150, and 220 GHz, and the elements of the 3x3 band-band covariance matrix (in units of uK_cmb^6) for that bin.
The measured bispectrum for no cluster cut is here.
The measured bispectrum for clusters cut above M200(rho_crit)=8e14 Msun/h is here.
The measured bispectrum for clusters cut above M200(rho_crit)=3e14 Msun/h is here.
If you have any questions regarding this data set or its use, please contact Tom Crawford (tcrawfor_at_kicp.uchicago.edu).
|
| |
| Thermal SZ Bispectrum Templates |
|
|
|
| |
These files contain the predicted thermal SZ bispectrum for three different levels of cluster cuts (no clusters cut, clusters above M200(rho_crit)=8e14 Msun/h cut, and clusters above M200(rho_crit)=3e14 Msun/h cut). These predictions were made using the prescription of Bhattacharya et al. (2012, ApJ 760 5).
The bispectrum values for each level of cluster cuts are in a single ascii file. The predicted values are given for each bispectrum bin in which the data bispectrum had nonzero weight (a total of 15,670 bins). For each bin, the file contains the center l value for each of the three sides of the (l1,l2,l3) triangles in that bin and the value of the predicted thermal SZ bispectrum at 150 GHz in uK_cmb^3.
The predicted tSZ bispectrum at 150 GHz for no cluster cut is here.
The predicted tSZ bispectrum at 150 GHz for clusters cut above M200(rho_crit)=8e14 Msun/h is here.
The predicted tSZ bispectrum at 150 GHz for clusters cut above M200(rho_crit)=3e14 Msun/h is here.
If you have any questions regarding this data set or its use, please contact Tom Crawford (tcrawfor_at_kicp.uchicago.edu) or Suman Bhattacharya (suman.bhattacharya79_at_gmail.com).
|
| |
| Beam Realizations |
|
|
|
| |
These files contain realizations of the SPT beam used in constructing the systematic error covariance matrix described in Section 4.2.1 of Crawford et al.(2013). In Crawford et al. (2013), the linear least-squares fit to the measured bispectrum is repeated 1000 times, each time modifying the bispectrum data or the signal model by a realization of four sources of systematic error: beams, bandpasses, absolute calibration, and the spectral behavior of the cosmic infrared background. The other three sources are simple to generate from the Gaussian priors in the Table 2 of the paper. The realizations of the beam error are more complicated, and we include the ones used in the paper here.
We include 1000 realizations of the l-space beam for each observing band. The beam realizations posted here are weighted averages of the realizations for each observing season (2008 or 2009). In Crawford et al. (2013), the bispectra from each observing field were modified individually using the beam from the appropriate season, but using these weighted beams produces nearly identical fit results.
The beam realization files are in FITS format, with the data in the primary FITS array. The array is 29951-by-1000 elements, where 29951 is the number of l values at which the beam is defined. The appropriate l array to use with these beam realizations is a 29951-element vector (starting at 0) with unit spacing.
The beam realizations for 95 GHz are here.
The beam realizations for 150 GHz are here.
The beam realizations for 220 GHz are here.
If you have any questions regarding this data set or its use, please contact Tom Crawford (tcrawfor_at_kicp.uchicago.edu).
|
| |
| Parameter Covariance Matrices |
|
|
|
| |
These files contain the statistical-only, systematic-only, and statistical-plus-systematic parameter covariance matrices for each level of cluster masking.
The statistical-only parameter covariance matrix for no cluster cut is here.
The statistical-only parameter covariance matrix for clusters cut above M200(rho_crit)=8e14 Msun/h is here.
The statistical-only parameter covariance matrix for clusters cut above M200(rho_crit)=3e14 Msun/h is here.
The systematic-only parameter covariance matrix for no cluster cut is here.
The systematic-only parameter covariance matrix for clusters cut above M200(rho_crit)=8e14 Msun/h is here.
The systematic-only parameter covariance matrix for clusters cut above M200(rho_crit)=3e14 Msun/h is here.
The statistical-plus-systematic parameter covariance matrix for no cluster cut is here.
The statistical-plus-systematic parameter covariance matrix for clusters cut above M200(rho_crit)=8e14 Msun/h is here.
The statistical-plus-systematic parameter covariance matrix for clusters cut above M200(rho_crit)=3e14 Msun/h is here.
If you have any questions regarding this data set or its use, please contact Tom Crawford (tcrawfor_at_kicp.uchicago.edu).
|
| |
|
|


