|
Project Supported by
|
NSF, National Science Foundation
KICP, Kavli Institute for Cosmological Physics
USAP, United States Antarctic Program
Raytheon Polar Support Corporation
|
|
|
Related Websites
|
CBI, Cosmic Background Imager
DASI, Degree Angular Scale Interferometer
WMAP, Wilkinson Microwave Anisotropy Probe
|
|
|
|
 | Plots |
|
 |
|
| |
| 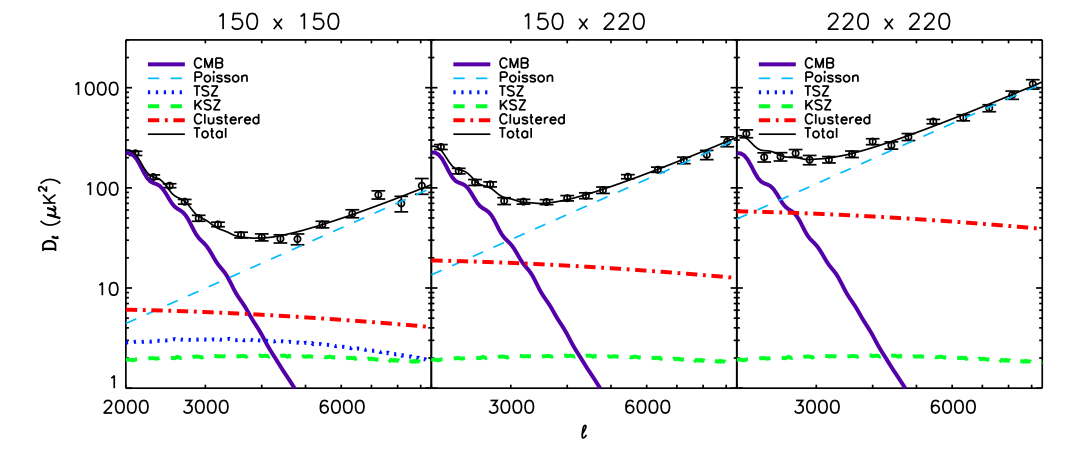 The SPT bandpowers (black circles) are plotted at each frequency along with the following model components: total power (thin, solid, black line), CMB (thick, solid, purple line), tSZ effect(dotted, blue line), clustered point source power (dot-dashed, red line), Poisson point source power (thin, dashed, cyan line), and kSZ effect (thick, dashed, green line).
In all cases, the kSZ effect is fixed to the Sehgal et al. 2009 model.
At 150x220 and 220x220, the plotted models are the maximum-likelihood solutions.
We also plot the maximum-likelihood CMB and Poisson point source components for the 150x150 bandpowers; however, the other components plotted at 150x150 are extrapolated from other data.
The tSZ component is set to the Lueker et al. 2009 maximum-likelihood amplitude for this kSZ model.
The clustered point source component at 150x150 GHz is fixed to the value inferred by extrapolating from the best-fit amplitudes of the other two power spectra assuming perfect correlation.
The SPT bandpowers (black circles) are plotted at each frequency along with the following model components: total power (thin, solid, black line), CMB (thick, solid, purple line), tSZ effect(dotted, blue line), clustered point source power (dot-dashed, red line), Poisson point source power (thin, dashed, cyan line), and kSZ effect (thick, dashed, green line).
In all cases, the kSZ effect is fixed to the Sehgal et al. 2009 model.
At 150x220 and 220x220, the plotted models are the maximum-likelihood solutions.
We also plot the maximum-likelihood CMB and Poisson point source components for the 150x150 bandpowers; however, the other components plotted at 150x150 are extrapolated from other data.
The tSZ component is set to the Lueker et al. 2009 maximum-likelihood amplitude for this kSZ model.
The clustered point source component at 150x150 GHz is fixed to the value inferred by extrapolating from the best-fit amplitudes of the other two power spectra assuming perfect correlation.
|
| |
| |
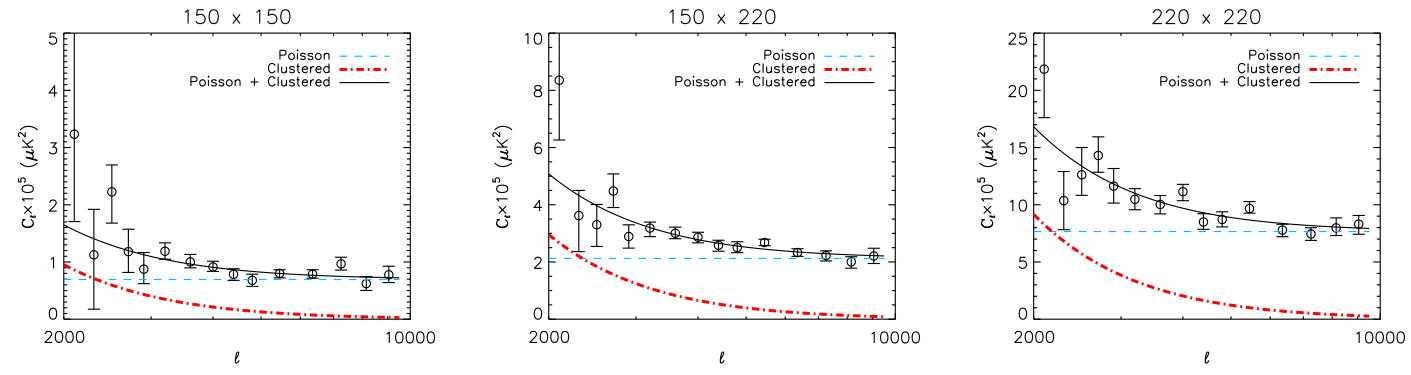 The residual SPT bandpowers (black circles) after subtraction of the tSZ, kSZ, and CMB model components.
The residual model components are as follows: total residual power (thin, solid, black line), clustered point source power (thick, dot-dashed, red line), and Poisson point source power (thin, dashed, cyan line). There is evidence for clustered point source power in all three bandpower sets.
The residual SPT bandpowers (black circles) after subtraction of the tSZ, kSZ, and CMB model components.
The residual model components are as follows: total residual power (thin, solid, black line), clustered point source power (thick, dot-dashed, red line), and Poisson point source power (thin, dashed, cyan line). There is evidence for clustered point source power in all three bandpower sets.
|
| |
| |
If you have any questions regarding this data set or its use please contact Nicholas Hall (nrhall_at_ucdavis.edu).
|


