|
|
 | Overview |
|
 |
|
|
This page provides data products associated with the
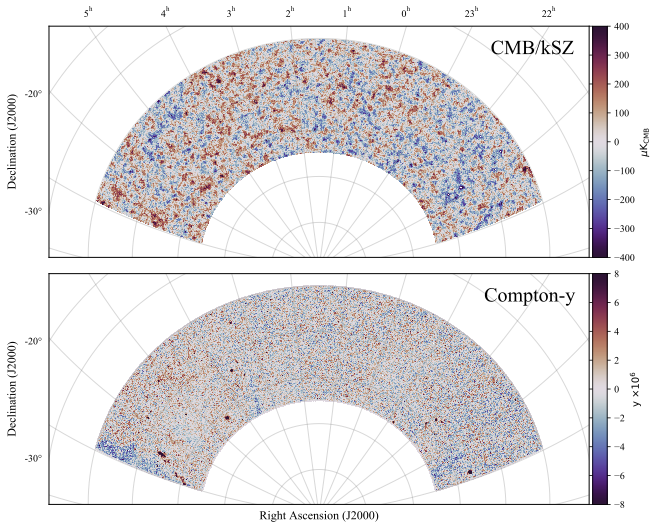
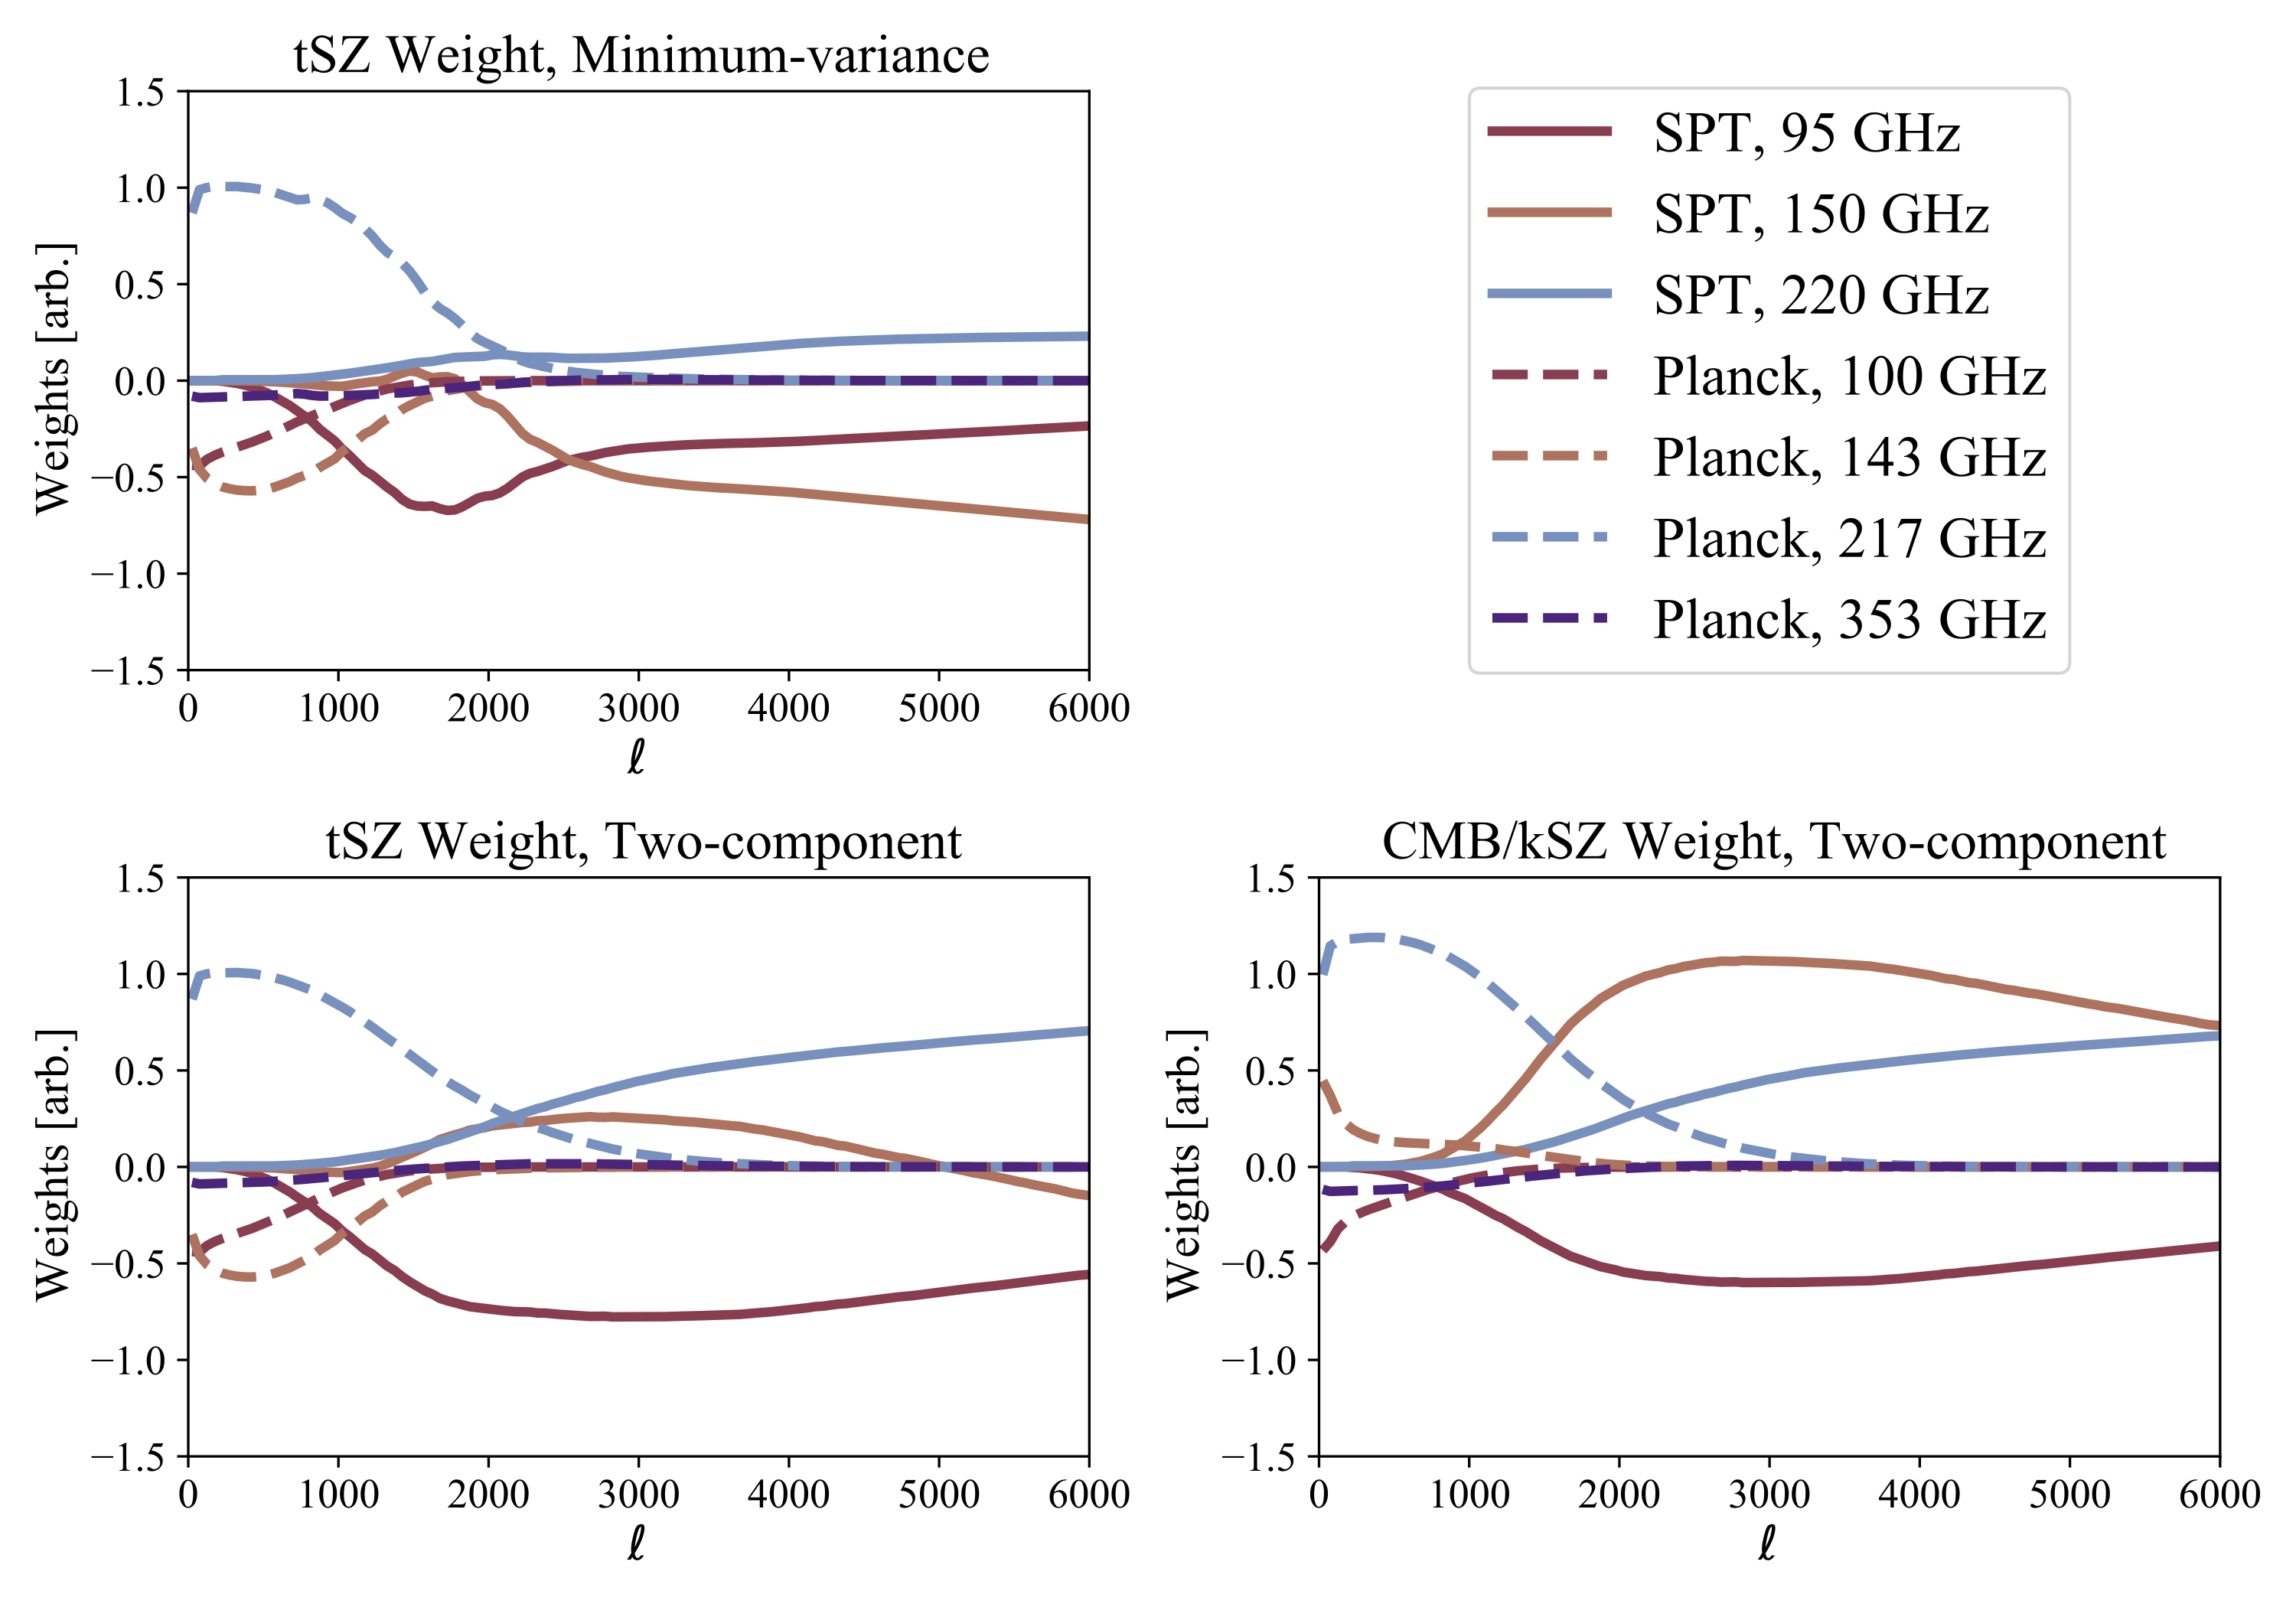
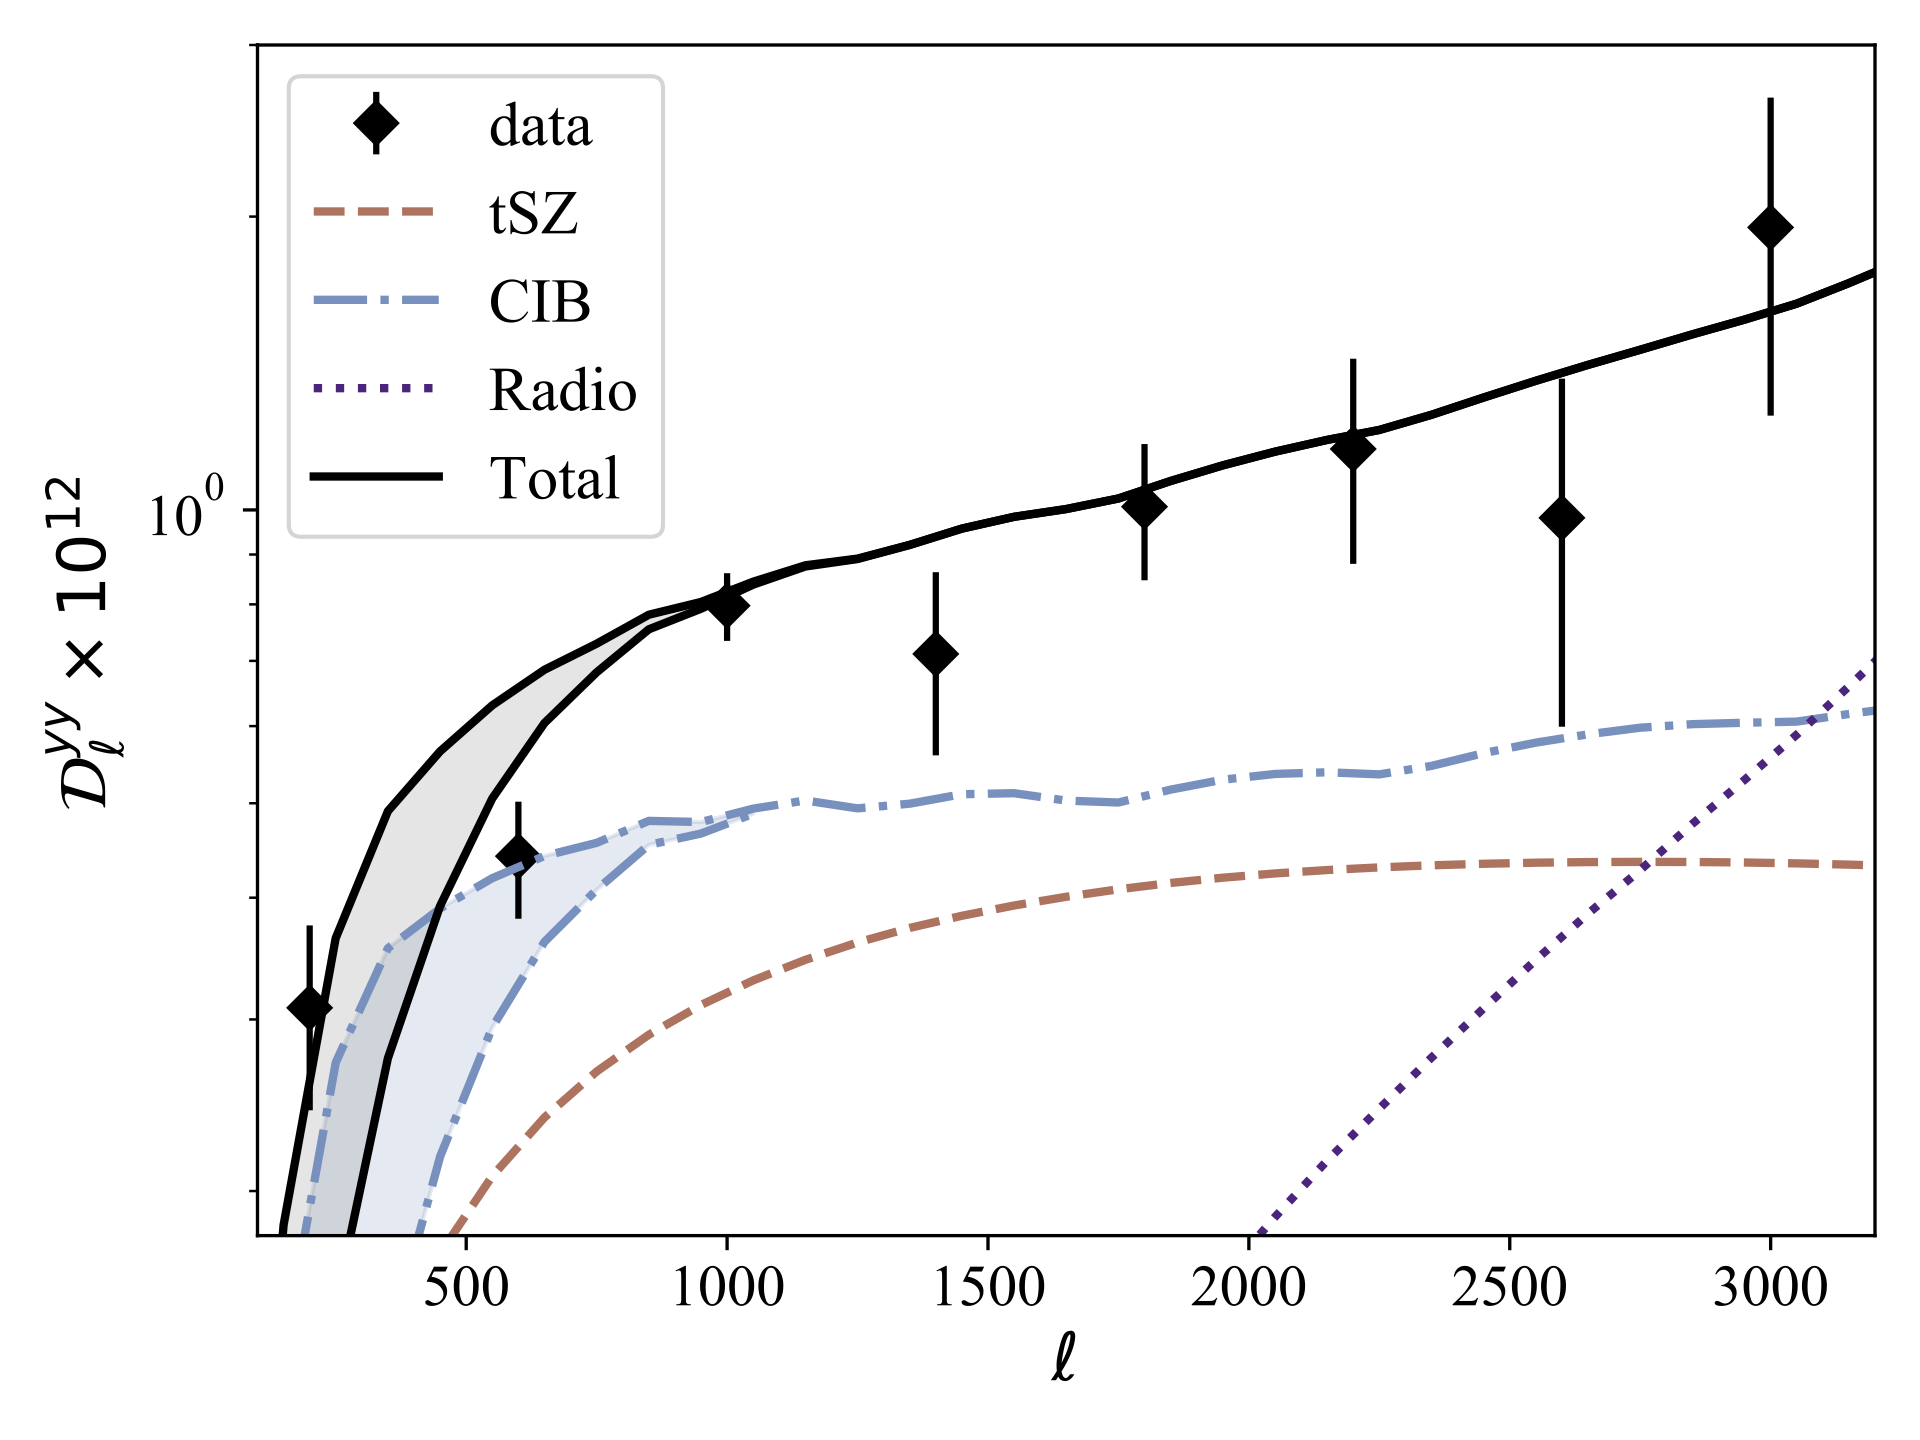
SPT-SZ + Planck CMB/kSZ and Compton-y maps described in arXiv:2102.05033, Bleem et al., 2021.
If you have any questions regarding these data products or their use, please contact Lindsey Bleem (lbleem_at_anl_dot_gov).
|
|
 | Figures |
|
 |
|
|
Individual figures are available in PDF format here or bundled in a tarball here. We highlight some figures below.
|
Two examples of component maps provided in association with this
work. (Top) tSZ-nulled CMB/kSZ map constructed using observations
from the 2500d SPT-SZ survey and Planck HFI. (Bottom)
Minimum-variance Compton-y map from the same. Both of these maps are
smoothed here for display purposes. (Figure 4 in Bleem et
al. 2021).
|
Relative azimuthally averaged band weights for the
single-component ("minimum-variance") y map (upper left), the
CMB-nulled ("two-component") y map (lower left), and the
tSZ-nulled ("two-component") CMB/kSZ map (lower right). (Figure 1 in Bleem et
al. 2021).
|
Power spectrum of the CMB-CIB-nulled Compton-y map. The data points
show the measured power spectrum of the y-map from the three-component
analysis in this work. The power spectrum is estimated using independent halves
of the data to avoid noise bias.
Lines show the expectation for power from various components in the y-map,
given the signal models used in the linear combination algorithm. (Figure 7 in Bleem et
al. 2021).
|
|
|
|
|
|
Contact: | | jc hyde.uchicago.edu |
|
Webmaster: | | egaltseva kicp.uchicago.edu |
Last
update: | | Feb 2021 |
|
|
|
|